- Department of Neurosurgery, Barrow Neurological Institute, St. Joseph's Hospital and Medical Center Phoenix, Arizona, USA
- School of Life Sciences, Arizona State University, Tempe, Arizona, USA
- College of Medicine, University of Arizona, Phoenix, Arizona, USA
Correspondence Address:
Mark C. Preul
Department of Neurosurgery, Barrow Neurological Institute, St. Joseph's Hospital and Medical Center Phoenix, Arizona, USA
DOI:10.4103/2152-7806.195577
Copyright: © 2016 Surgical Neurology International This is an open access article distributed under the terms of the Creative Commons Attribution-NonCommercial-ShareAlike 3.0 License, which allows others to remix, tweak, and build upon the work non-commercially, as long as the author is credited and the new creations are licensed under the identical terms.How to cite this article: Nikolay L. Martirosyan, Joseph Georges, M. Yashar S. Kalani, Peter Nakaji, Robert F. Spetzler, Burt G. Feuerstein, Mark C. Preul. Handheld confocal laser endomicroscopic imaging utilizing tumor-specific fluorescent labeling to identify experimental glioma cells in vivo. 12-Dec-2016;7:
How to cite this URL: Nikolay L. Martirosyan, Joseph Georges, M. Yashar S. Kalani, Peter Nakaji, Robert F. Spetzler, Burt G. Feuerstein, Mark C. Preul. Handheld confocal laser endomicroscopic imaging utilizing tumor-specific fluorescent labeling to identify experimental glioma cells in vivo. 12-Dec-2016;7:. Available from: http://surgicalneurologyint.com/surgicalint_articles/handheld-confocal-laser-endomicroscopic-imaging-utilizing-tumor%e2%80%91specific-fluorescent-labeling-to-identify-experimental-glioma-cells-in-vivo/
Date of Submission
05-Feb-2016
Date of Acceptance
11-Jul-2016
Date of Web Publication
12-Dec-2016
Abstract
Background:We have reported that handheld confocal laser endomicroscopy (CLE) can be used with various nonspecific fluorescent dyes to improve the microscopic identification of brain tumor and its boundaries. Here, we show that CLE can be used experimentally with tumor-specific fluorescent labeling to define glioma margins in vivo.
Methods:Thirteen rats underwent craniectomy and in vivo imaging 21 days after implantation with green fluorescent protein (GFP)-labeled U251 (n = 7) cells or epidermal growth factor receptor (EGFR) overexpressing F98 cells (n = 6). Fluorescein isothiocyanate (FITC) conjugated EGFR fluorescent antibody (FITC-EGFR) was applied for contrast in F98 tumors. Confocal images of normal brain, obvious tumor, and peritumoral zones were collected using the CLE system. Bench-top confocal microscopy and hematoxylin and eosin-stained sections were correlated with CLE images.
Results:GFP and FITC-EGFR fluorescence of glioma cells were detected by in vivo visible-wavelength fluorescence CLE. CLE of GFP-labeled tumors revealed bright individual satellite tumor cells within peritumoral tissue, a definitive tumor border, and subcellular structures. Imaging with FITC-EGFR labeling provided weaker contrast in F98-EGFR tumors but was able to delineate tumor cells. Imaging with both methods in various tumor regions correlated with standard confocal imaging and clinical histology.
Conclusions:These data suggest that in vivo CLE of selectively tagged neoplasms could allow specific interactive identification of tumoral areas. Imaging of GFP and FITC-EGFR provides real-time histologic information precisely related to the site of microscopic imaging of tumor.
Keywords: Confocal laser endomicroscopy, confocal microscopy, green fluorescent protein, fluorescent antibody, malignant gliomas, molecular imaging
INTRODUCTION
Gliomas are diffusively growing malignant primary tumors of the central nervous system. The penetrating nature of gliomas means that total resection is an illusory goal. Tumor cells invade surrounding tissue, and thus, by definition, are not resected. Remaining cells act as protagonists for what is interpreted eventually on imaging as tumor recurrence. Historically and practically, the ability to detect the tumor margin for surgery has been limited by the inability to identify the margin on a cellular basis in vivo. Nevertheless, data from various investigations have highlighted the importance of the extent of resection and its influence on patient survival.[
Consequently, techniques that would allow surgeons to intraoperatively delineate a microscopic in vivo margin and to identify tumor beyond the resection cavity would be a significant advance. 5-aminolevulinic acid (5-ALA) is a photosensitizer precursor that is converted into protoporphyrin IX (PPIX), an actual photosensitizer that is part of the endogenous heme cycle.[
Fluorescence imaging techniques have improved in vivo real-time identification of the infiltrating edge of tumors as well as assessment of their histologic features. Confocal laser endomicroscopy (CLE) yields fluorescence-based images of brain tissue in vivo with cellular resolution (“optical biopsies”). The feasibility of handheld CLE in a murine malignant glioma model to distinguish between normal brain, microvasculature, and tumor margins has been evaluated.[
CLE allows investigators to evaluate cytoarchitectural information from several topical or systemically delivered fluorophores in experimental and human brain tumors: Fluorescein sodium, acridine orange, acriflavine, cresyl violet, 5-ALA, and indocyanine green.[
MATERIALS AND METHODS
Animals
Thirteen male Crl:NIH-Foxn1rnu rats (5 weeks old) were obtained from Charles River Laboratories International, Inc. (Wilmington, Massachusetts, USA). Experiments were performed in accordance with the guidelines and regulations set forth by the National Institutes of Health's Guide for the Care and Use of Laboratory Animals and were approved by the Institutional Animal Care and Use Committee of Barrow Neurological Institute and St. Joseph's Hospital and Medical Center, Phoenix, Arizona.
Brain tumor models
Green fluorescent protein tumor model
To generate constitutively fluorescent glioma cells, GFP was cloned into mammalian retroviral expression vector pLXSN (Clonetech, Mountain View, California, USA). Virus was generated using GFP cDNA cloned in pLXSN and packaged using Phoenix A cells. U251 human glioma cells (American Type Culture Collection, Manassas, Virginia, USA) were infected with the virus and selected for GFP expression by fluorescence-activated cell sorting.
Epidermal growth factor receptor tumor model
In human gliomas, EGFR is commonly overexpressed.[
Intracranial implantation
Each rat was anesthetized by intraperitoneal injection of a mixture of xylazine (80 mg/kg) and ketamine (10 mg/kg) and affixed in a stereotactic headframe (Model 900, David Kopf Instruments, Tujunga, California, USA). A 20-mm incision was made in the skin overlying the skull, exposing the coronal suture and bregma. A bur hole was made 3.5 mm to the right of bregma. The tumor cells were infused at a depth of 4.5 mm below the surface of the brain after the syringe (World Precision Instruments, Sarasota, Florida, USA) was advanced 5 mm to create a 0.5-mm pocket. The cell suspension was infused over 3 minutes using a UMP3-1 UltraMicroPump microinjector (World Precision Instruments, Sarasota, Florida, USA) set to a volume of 10 μL with an infusion rate of 3.33 μL/minute. The needle was withdrawn 2 minutes after the injection to minimize the backflow of the cell suspension. Bone wax was used to cover the bur hole. The skin incision was closed with interrupted sutures.
Animal surgery
Twenty-one days after xenograft implantation, the rats underwent a craniectomy and durotomy to expose the surfaces of both cerebral hemispheres and for intraoperative imaging. Animals underwent appropriate general anesthesia, as described earlier, and oxygen supply and body temperature were maintained throughout the procedure. Intraparenchymal brain tumors were macroscopically identified in the right hemisphere of all rats designated for main experiments. Saline irrigation provided successful hemostasis throughout the procedure. After imaging was performed, anesthetized animals were euthanized following institutional guidelines.
In vivo confocal laser endomicroscopy
In vivo CLE was performed using the Optiscan 5.1 system. This system contains a handheld miniaturized scanner designed as a rigid probe with a 6.3-mm outer diameter, providing a working length of 150 mm (Optiscan Pty. Ltd., Victoria, Australia and Zeiss Meditec AG, Jena, Germany). A 488-nm diode laser provided incident excitation light, and fluorescent emission was detected at 505-585 nm using a band-pass filter, both via a single optical fiber acting as the excitation and detection pinholes for confocal isolation of the focal plane. The detector signal was digitized synchronously with the scanning to construct images parallel to the tissue surface (en face optical sections). Laser power was typically set to 550–900 μW for brain tissue; maximum power was limited to 1000 μW. A field of view of 475 × 475 μm (approximately 1000 × magnification on a 21-inch screen) was scanned either at 1024 × 512 pixels (0.8/s frame rate) or at 1024 × 1024 pixels (at 1.2/s frame rate) with a lateral resolution of 0.7 μm and an axial resolution (i.e., effective optical slice thickness) of approximately 4.5 μm. The resulting images were stored digitally and could be recorded as time-lapse series. During the procedure, a foot pedal provided remote control of the variable confocal imaging plane depth from the surface to a depth of 0 to 500 μm.
The confocal probe affixed to a retractor system was moved gently along the surface of the brain tissue to obtain images from several regions of interest (ROIs). ROIs included normal brain, regions of obvious tumor, and the transitional zone between what appeared to be the normal brain and tumor. The probe was moved smoothly between different ROIs without losing contact with the tissue. Images were acquired by optical sectioning of the tissue from each ROI at the brain surface and from deeper structures. Unique aspects of individual cells and surrounding neoplastic tissue were seen as the endomicroscopic probe acquired images throughout its focal depth range. The total imaging time was approximately 20 minutes per rat.
In vivo fluorescent antibody labeling
Tumor cells were labeled in vivo with a fluorescently conjugated antibody. FITC was conjugated to EGFR antibody to provide an excitation-emission spectrum similar to GFP (Abcam, Cambridge, Massachusetts, USA). The fluorescently conjugated antibody was infused into the tumor region 24 hours prior to imaging. Intraoperative imaging with CLE was performed on the fluorescently labeled EGFR-overexpressing tumors. Frank tumor regions, tumor margins, and contralateral brain were examined for the appearance of fluorescently labeled cells.
Tissue sampling, histology, and data processing
Multiple cold-cut biopsies were harvested from each rat. Brain tissue slices (0.5 cm2) containing several ROIs were cut parallel to the surface. After the in vivo imaging, tissue was imaged ex vivo with a Zeiss 710 inverted laser scanning confocal microscope. For comparison to the CLE, we equipped the Zeiss 710 with a Plan Apochromat 20 × 0.8 NA objective, and set the confocal aperture for 1 Airy unit. Areas imaged using the confocal microscope and CLE were marked with tissue ink so that locations could be precisely correlated and validated with conventional histology. The tissue was placed in a cassette for standard formalin fixation and paraffin embedding. Histologic assessment was performed using standard light microscopic evaluation of 5- μm thick H and E–stained sections with an Olympus BX60 upright microscope. Careful labeling and grouping of acquired confocal images and specific biopsy samples ensured correct correlation.
4’,6-diamidino-2-phenylindole staining for green fluorescent protein-labeled tumors
One biopsy from each animal with GFP-labeled tumors was fluorescently labeled with 4’,6-diamidino-2-phenylindole (DAPI; Invitrogen, Carlsbad, California, USA) to specifically label all cell nuclei. We identified GFP-labeled tumor cells by excitation with a 488-nm diode laser and collecting 505–525-nm emissions. We identified DAPI-labeled nuclei by 405-nm diode laser excitation and 415–465-nm emission. DAPI-labeled nuclei of tumor and nontumor areas were counted. Two-tailed Student's t-tests were used to compare nuclei counts from tumor and nontumor areas. The significance level was set at P < 0.05.
RESULTS
Confocal laser endomicroscopy imaging of green fluorescent protein-labeled cells
Intraoperative CLE of GFP-labeled cells allowed selective identification of the tumor margin while providing striking optically identifiable cellular and subcellular structures within the tumor cells, which correlated with confocal and conventional histology and with known tumor tissue architecture. Within obvious neoplastic tissue, imaging of cellular GFP produced images morphologically consistent with cytoplasmic labeling of tumor cells. These features included hypercellularity, pleomorphism, atypia, and possible mitoses [Figures
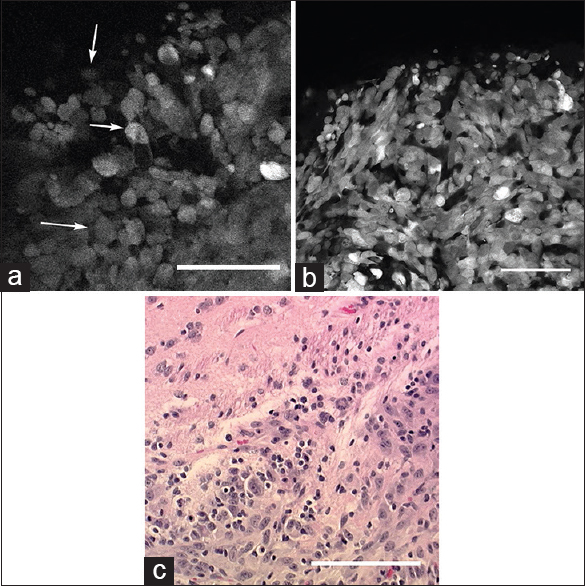
Figure 1
(a) In vivo image of the tumor border obtained with the confocal endomicroscope demonstrates intracellular distribution of green fluorescent protein. Atypical cells (arrows) consistent with tumor cells are identified within regions of cellular tumor and infiltrating edge. (b) Ex vivo bench-top confocal and (c) Hematoxylin and eosin (×20) images from the same region of interest demonstrate atypical cells within the tumor and tumor edge, similar to the in vivo image. Scale bar 100 μm. Used with permission from Barrow Neurological Institute, Phoenix, Arizona
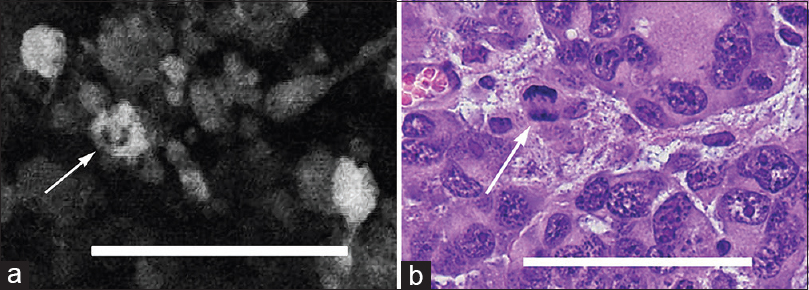
Figure 2
(a) In vivo image obtained with the confocal endomicroscope using green fluorescent protein reveals a possible mitotic figure in a tumor cell (arrow). (b) Hematoxylin and eosin-stained section (×40) from the same region of interest shows a similar mitotic figure (arrow). Scale bar 100 μm. Used with permission from Barrow Neurological Institute, Phoenix, Arizona
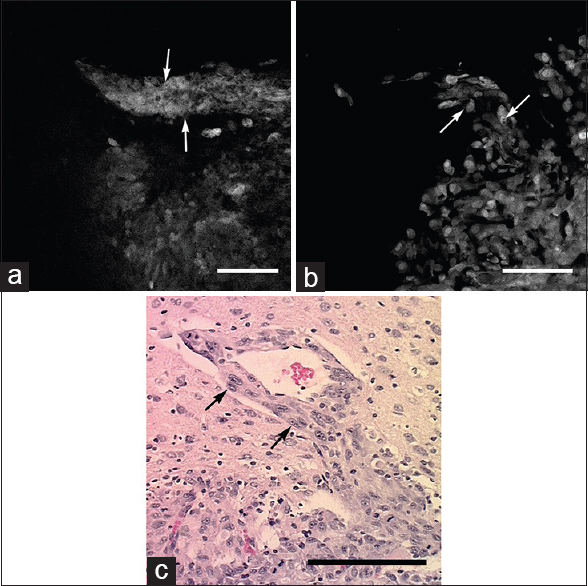
Figure 3
Images obtained from tumor border. (a) In vivo confocal endomicroscope image demonstrates tumor cells aligned along a blood vessel progressing out from the main tumor mass (arrows). (b) Ex vivo bench-top confocal and (c) Hematoxylin and eosin section (×20) from the same region of interest show similar histologic features (arrows). Scale bar 100 μm. Used with permission from Barrow Neurological Institute, Phoenix, Arizona
Evaluation of DAPI-stained specimens with conventional confocal microscope showed hypercellular tissue corresponding to tumor areas on H and E staining. These regions also showed intensive green fluorescence. Areas containing significantly fewer DAPI-stained nuclei appeared to be normal brain tissue with H and E staining and lacked green fluorescence when imaged in the same optical plane [Figures
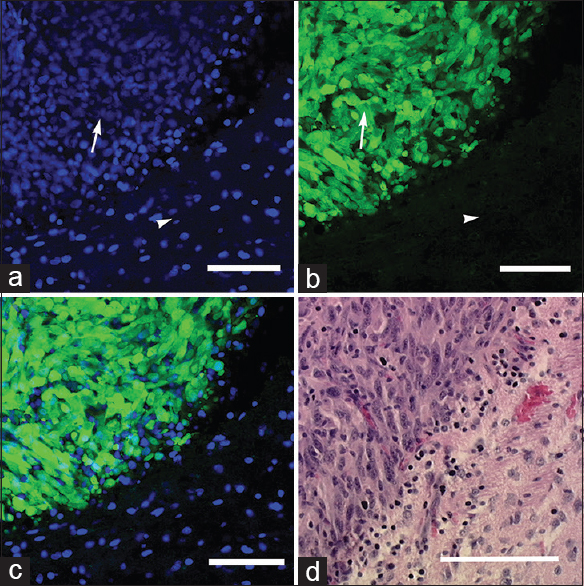
Figure 4
Ex vivo images obtained with the bench-top confocal microscope: (a) 4’,6-diamidino-2-phenylindole (DAPI) staining shows areas of hypercellular tumor (arrow) and normal adjacent brain tissue (arrowhead); (b) green fluorescent protein-labeled tumor cells (arrow) and nonfluorescent normal brain tissue (arrowhead); and (c) merged DAPI-GFP image. (d) Hematoxylin and eosin section (×20) from the same region of interest shows similar histologic characteristics. Scale bar 100 μm. Used with permission from Barrow Neurological Institute, Phoenix, Arizona
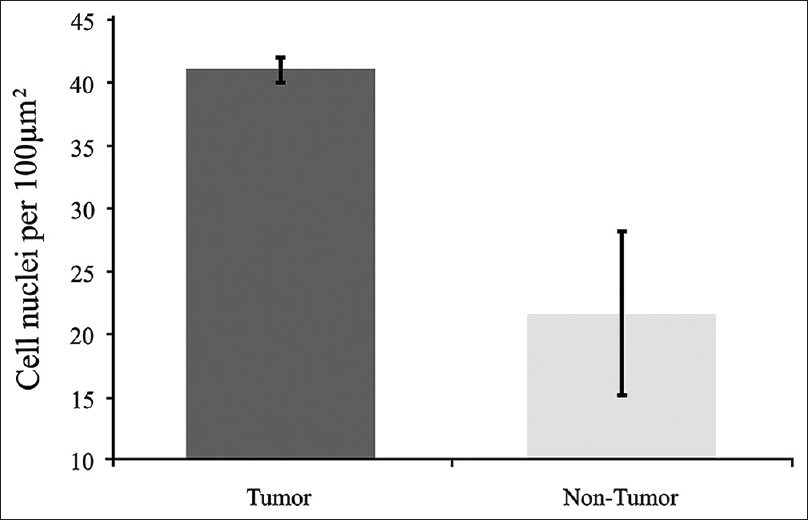
Figure 5
Comparison of cell nuclei (4’,6-diamidino-2-phenylindole staining) counts of tumor and nontumor areas. Tumor cell nuclei count 53 in 10 slides. Non-tumor cell nuclei count 21 in 3 slides. Error bars are ± 1 SD. (Comparison by t-test, P < 0.05, indicating statistically significant difference). Used with permission from Barrow Neurological Institute, Phoenix, Arizona
Confocal laser endomicroscopy imaging of fluorescein isothiocyanate fluorescent antibody-labeled cells
CLE images were clear enough to reveal cellular and subcellular detail of FITC conjugated antibody selectively labeled tumor cells in vivo [
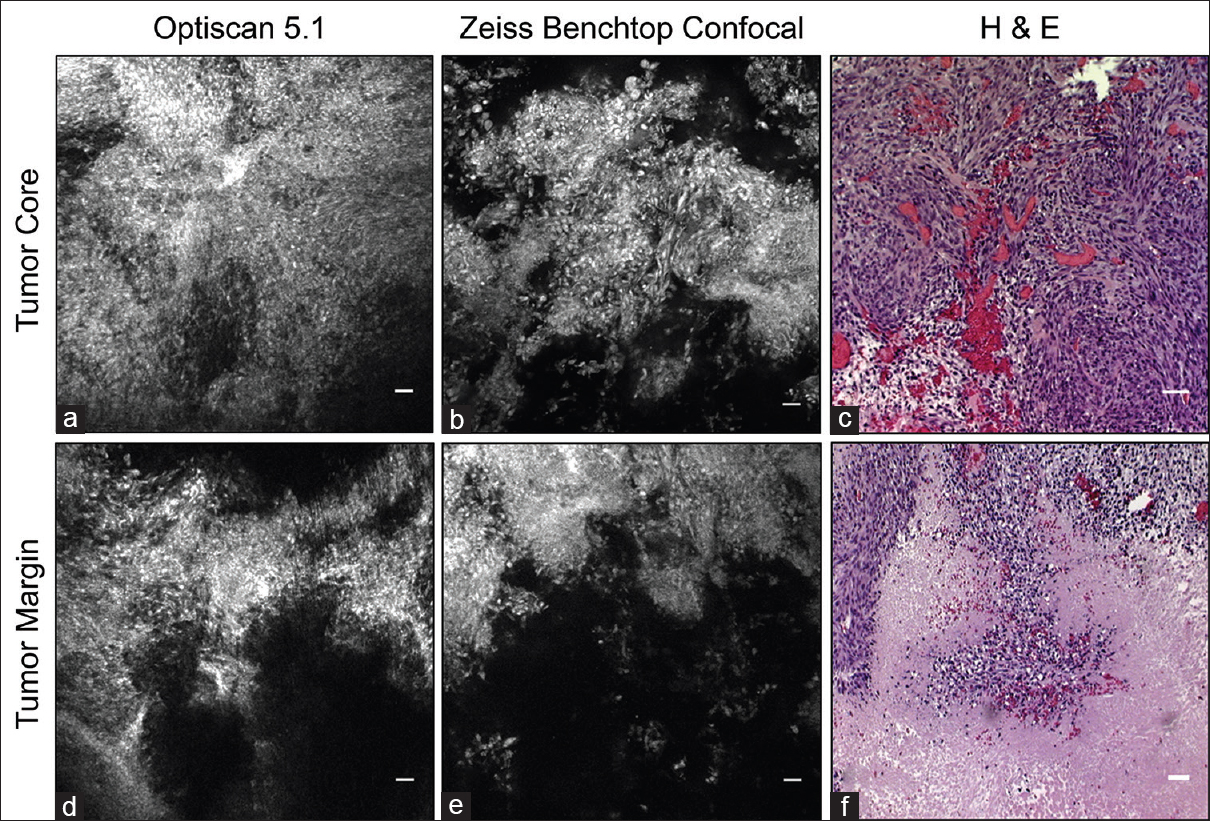
Figure 6
Fluorescein isothiocyanate conjugated epidermal growth factor receptor antibody labels tumor cells in the tumor core and margin. (a and d) In vivo images acquired with Optiscan 5.1. (b and e) Corresponding ex vivo images collected with Zeiss benchtop confocal microscope. Note similar fluorescent regions and image quality. (c and f) Corresponding Hematoxylin and eosin images. Scale bar equals 20 μm. Used with permission from Barrow Neurological Institute, Phoenix, Arizona
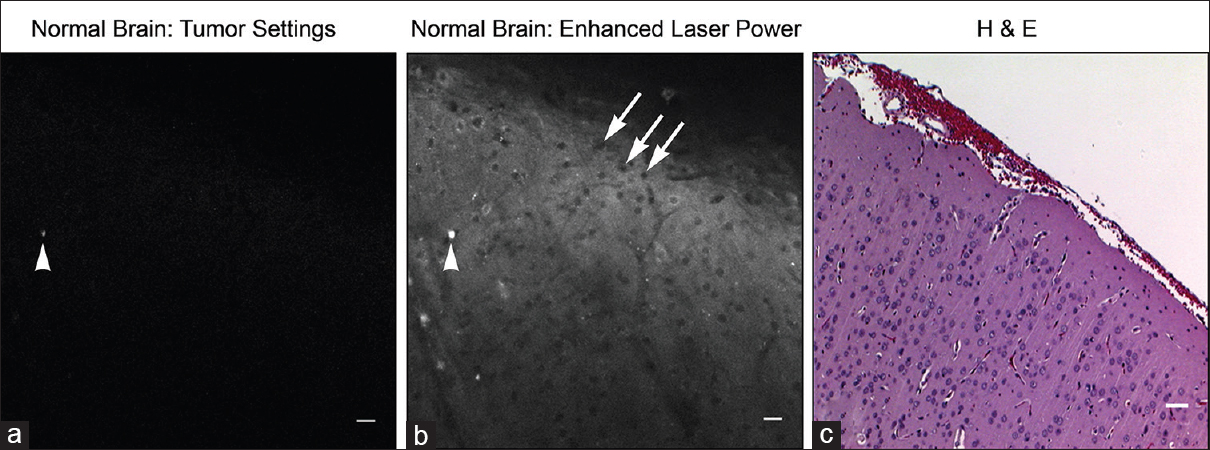
Figure 7
Seven-fold greater laser power required to visualize autofluorescence from tumor-free brain regions. Note corresponding fluorescent artifact between images (arrowhead) and non-labeled cell bodies (arrows). Image (a) taken with confocal endomicroscope, image (b) taken with bench-top Zeis 710 confocal microscope (higher laser power), and image (c) is the corresponding Hematoxylin and eosin image. Scale bar equals 20 μm. Used with permission from Barrow Neurological Institute, Phoenix, Arizona
DISCUSSION
This study represents a definitive in vivo application of visible-wavelength fluorescence CLE for imaging specific molecular fluorescent labeling of an infiltrative human glioma cell line and a rodent glioma cell line using EGFR as a detected marker of importance to human malignant glioma. The fluorescence corresponded to tumor cells, which made their identification precise and not confounded by fluorescent signal from the background and adjacent structures.
A previous pilot study in a murine glioma cell line allowed CLE detection of second tyrosinase-related protein (TRP-2), a bound protein overexpressed in GL261 mouse glioma cells.[
Although the CLE 475 × 475- μm field of view is constrained, extremely rapid scans of a large operative field are possible by simply moving the instrument to various location for acquisition of an “optical biopsy.” The main advantage of the instrument is its ability to study large regions of tumor or resection beds over time periods that multiple frozen section biopsies covering the same area cannot approach. Further development of clinically effective imaging agents could provide instant and real-time intraoperative histopathology while potentially eliminating delays associated with operating room work-flow, processing, and interpretation of frozen sections. Our ability to quickly assess multiple tumor regions is encouraging, although the current probe design creates challenges for imaging deep or remote regions.[
In vivo detection and appropriate interpretation of tissue cytoarchitecture by CLE is critically dependent on imaging agents. Earlier studies suggest that CLE fluorescent images developed from fluorescein, acridine orange, acriflavine, cresyl violet percholate, 5-ALA, and indocyanine green can discriminate features of tumor and normal brain [
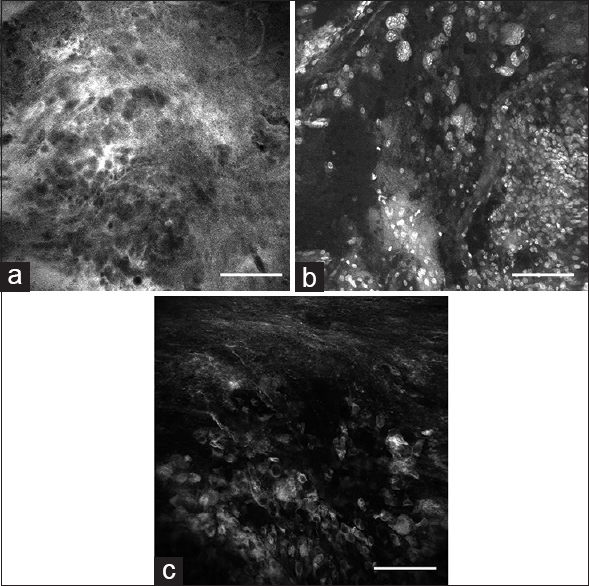
Figure 8
In vivo images obtained with the confocal endomicroscope using (a) fluorescein sodium, (b) acriflavine, (c) indocyanine green from the tumor border region reveal nonspecific staining characteristics of tumor cells, as well as other brain tissue components compared to green fluorescent protein. Scale bar 100 μm. Used with permission from Barrow Neurological Institute, Phoenix, Arizona
Previous studies have suggested that a learning curve is associated with the interpretation of confocal images, especially those of tissue labeled with relatively nonspecific fluorescent agents.[
GFP is a 238-amino acid polypeptide with numerous experimental applications. We used it in this setting for its convenient and specific labeling and to assess the ability of CLE to image within a human glioma cell line. It has been used in vivo as a marker for gene expression for protein localization and folding and as a probe for protein-to-protein interactions.[
FITC is a small fluorophore similar to the clinical contrast agent fluorescein. Although we did not observe a loss of fluorescence signal intensity while imaging FITC-EGFR, images generated by the endomicroscope during in vivo and ex vivo imaging of FITC were less bright and distinct compared to those imaged with GFP labeling. This difference in signal strength may be partially related to the concentrated cytoplasmic expression of GFP within transduced tumor cells compared to greater cell membrane expression of EGFR in transduced cells. Some variants of EGFR represent only a small range of the unique glioma surface molecules that may be exploited as labeling targets that may be imaged with CLE.[
In this study, tumor cells constitutively expressing GFP or overexpressing EGFR were implanted into rat brains. Our results show that the concept of human in vivo imaging of selective molecular fluorescent labeling of human and rodent glioma cells with a portable intraoperative CLE system is promising.[
Although the range of this 488-nm CLE system would seem to be restrictive and specific molecular labels may not be visible because they are out of the detectable operating parameters of the system, such labels could conceivably be conjugated directly to a different fluorophore within the system's detection range (a relatively simple chemistry problem) and thus become viewable and informative. As CLE technology grows, multiple bandwidth imaging, e.g. including near-infrared spectrum laser, or widely tunable laser, may become available allowing imaging of multiple co-localized tumor cell fluorescent labels for greater specificity and selectivity.[
CONCLUSIONS
CLE with specific fluorescence labeling using GFP and an FITC-EGFR conjugated antibody provided real-time in vivo histologic information precisely related to the site of microscopic imaging of an animal glioma model. Correlative histopathologic tumor features were identified, and a definitive tumor border was delimited, especially with the rapid and dynamic positioning of the imaging probe. The data suggest that in vivo CLE of selectively fluorescently tagged neoplasms allows interactive identification of tumor areas in the investigated animal glioma model. Establishing protocols for safe delivery of specifically targeted fluorescent molecules, either inserted into glioma cells before surgery or applied to the tumor intraoperatively, to be used with CLE in humans should be possible. In principle, this imaging technology could substantially improve intraoperative decisions during the resection of brain tumors and radically change the neurosurgery-neuropathology workflow in the operating room.
Financial support and sponsorship
Funding for this study was provided by Barrow Neurological Foundation and the Newsome Endowed Chair in Neurosurgery Research at Barrow Neurological Institute. The Optiscan 5.1 confocal endomicroscope system and Zeiss LSM 710 were provided by Carl Zeiss Meditec AG (Jena, Germany), which has no financial interest in this study at Barrow Neurological Institute.
Conflicts of interest
There are no conflicts of interest.
References
1. Ammirati M, Vick N, Liao YL, Ciric I, Mikhael M. Effect of the extent of surgical resection on survival and quality of life in patients with supratentorial glioblastomas and anaplastic astrocytomas. Neurosurgery. 1987. 2: 201-6
2. Ando T, Kobayashi E, Liao H, Maruyama T, Muragaki Y, Iseki H. Precise comparison of protoporphyrin IX fluorescence spectra with pathological results for brain tumor tissue identification. Brain Tumor Pathol. 2011. 28: 43-51
3. Breuskin D, Divincenzo J, Kim YJ, Urbschat S, Oertel J. Confocal laser endomicroscopy in neurosurgery: A new technique with much potential. Minim Invasive Surg 2013. 2013. p. 851819-
4. Charalampaki P, Javed M, Daali S, Heiroth HJ, Igressa A, Weber F. Confocal Laser Endomicroscopy for Real-time Histomorphological Diagnosis: Our Clinical Experience With 150 Brain and Spinal Tumor Cases. Neurosurgery. 2015. 62: 171-6
5. Devaux BC, O’Fallon JR, Kelly PJ. Resection, biopsy, and survival in malignant glial neoplasms. A retrospective study of clinical parameters, therapy, and outcome. J Neurosurg. 1993. 78: 767-75
6. Fenton KE, Martirosyan NL, Abdelwahab MG, Coons SW, Preul MC, Scheck AC. In vivo visualization of GL261-luc2 mouse glioma cells by use of Alexa Fluor-labeled TRP-2 antibodies. Neurosurg Focus. 2014. 36: E12-
7. Foersch S, Kiesslich R, Waldner MJ, Delaney P, Galle PR, Neurath MF. Molecular imaging of VEGF in gastrointestinal cancer in vivo using confocal laser endomicroscopy. Gut. 2010. 59: 1046-55
8. Georges JF, Martirosyan NL, Eschbacher J, Nichols J, Tissot M, Preul MC. Sulforhodamine 101 selectively labels human astrocytoma cells in an animal model of glioblastoma. J Clin Neurosci. 2014. 21: 846-51
9. Hatanpaa KJ, Burma S, Zhao D, Habib AA. Epidermal growth factor receptor in glioma: Signal transduction, neuropathology, imaging, and radioresistance. Neoplasia. 2010. 12: 675-84
10. Hsu ST, Blaser G, Jackson SE. The folding, stability and conformational dynamics of beta-barrel fluorescent proteins. Chem Soc Rev. 2009. 38: 2951-65
11. Lacroix M, Abi-Said D, Fourney DR, Gokaslan ZL, Shi W, DeMonte F. A multivariate analysis of 416 patients with glioblastoma multiforme: Prognosis, extent of resection, and survival. J Neurosurg. 2001. 95: 190-8
12. Martirosyan NL, Cavalcanti DD, Eschbacher JM, Delaney PM, Scheck AC, Abdelwahab MG. Use of in vivo near-infrared laser confocal endomicroscopy with indocyanine green to detect the boundary of infiltrative tumor. J Neurosurg. 2011. 115: 1131-8
13. Martirosyan NL, Eschbacher JM, Kalani MY, Turner JD, Belykh E, Spetzler RF. Prospective evaluation of the utility of intraoperative confocal laser endomicroscopy in patients with brain neoplasms using fluorescein sodium: Experience with 74 cases. Neurosurg Focus. 2016. 40: E11-
14. Martirosyan NL, Georges J, Eschbacher JM, Cavalcanti DD, Elhadi AM, Abdelwahab MG. Potential application of a handheld confocal endomicroscope imaging system using a variety of fluorophores in experimental gliomas and normal brain. Neurosurg Focus. 2014. 36: E16-
15. Mawhinney RM, Staveley BE. Expression of GFP can influence aging and climbing ability in Drosophila. Genet Mol Res. 2011. 10: 494-505
16. Meza D, Wang D, Wang Y, Borwege S, Sanai N, Liu JT. Comparing high-resolution microscopy techniques for potential intraoperative use in guiding low-grade glioma resections. Lasers Surg Med. 2015. 47: 289-95
17. Misteli T, Spector DL. Applications of the green fluorescent protein in cell biology and biotechnology. Nature Biotechnol. 1997. 15: 961-4
18. Mooney MA, Zehri AH, Georges JF, Nakaji P. Laser scanning confocal endomicroscopy in the neurosurgical operating room: A review and discussion of future applications. Neurosurg Focus. 2014. 36: E9-
19. Nguyen QT, Olson ES, Aguilera TA, Jiang T, Scadeng M, Ellies LG. Surgery with molecular fluorescence imaging using activatable cell-penetrating peptides decreases residual cancer and improves survival. Proc Natl Acad Sci U S A. 2010. 107: 4317-22
20. Nitta T, Sato K. Prognostic implications of the extent of surgical resection in patients with intracranial malignant gliomas. Cancer. 1995. 75: 2727-31
21. Olson ES, Jiang T, Aguilera TA, Nguyen QT, Ellies LG, Scadeng M. Activatable cell penetrating peptides linked to nanoparticles as dual probes for in vivo fluorescence and MR imaging of proteases. Proc Natl Acad Sci U S A. 2010. 107: 4311-6
22. Peng Q, Berg K, Moan J, Kongshaug M, Nesland JM. 5-Aminolevulinic acid-based photodynamic therapy: Principles and experimental research. Photochem Photobiol. 1997. 65: 235-51
23. Rostomily RC, Spence AM, Duong D, McCormick K, Bland M, Berger MS. Multimodality management of recurrent adult malignant gliomas: Results of a phase II multiagent chemotherapy study and analysis of cytoreductive surgery. Neurosurgery. 1994. 35: 378-88
24. Sanai N, Eschbacher J, Hattendorf G, Coons SW, Preul MC, Smith KA. Intraoperative confocal microscopy for brain tumors: A feasibility analysis in humans. Neurosurgery. 2011. 68: 282-90
25. Sanai N, Snyder LA, Honea NJ, Coons SW, Eschbacher JM, Smith KA. Intraoperative confocal microscopy in the visualization of 5-aminolevulinic acid fluorescence in low-grade gliomas. J Neurosurg. 2011. 115: 740-8
26. Sankar T, Delaney PM, Ryan RW, Eschbacher J, Abdelwahab M, Nakaji P. Miniaturized handheld confocal microscopy for neurosurgery: Results in an experimental glioblastoma model. Neurosurgery. 2010. 66: 410-7
27. Schucht P, Knittel S, Slotboom J, Seidel K, Murek M, Jilch A. 5-ALA complete resections go beyond MR contrast enhancement: Shift corrected volumetric analysis of the extent of resection in surgery for glioblastoma. Acta Neurochir. 2014. 156: 305-12
28. Tabori U, Rienstein S, Dromi Y, Leider-Trejo L, Constantini S, Burstein Y. Epidermal growth factor receptor gene amplification and expression in disseminated pediatric low-grade gliomas. J Neurosurg. 2005. 103: 357-61
29. van Dam GM, Themelis G, Crane LM, Harlaar NJ, Pleijhuis RG, Kelder W. Intraoperative tumor-specific fluorescence imaging in ovarian cancer by folate receptor-alpha targeting: First in-human results. Nature Med. 2011. 17: 1315-9
30. Widhalm G, Wolfsberger S, Minchev G, Woehrer A, Krssak M, Czech T. 5-Aminolevulinic acid is a promising marker for detection of anaplastic foci in diffusely infiltrating gliomas with nonsignificant contrast enhancement. Cancer. 2010. 116: 1545-52
31. Wikstrand CJ, McLendon RE, Friedman AH, Bigner DD. Cell surface localization and density of the tumor-associated variant of the epidermal growth factor receptor, EGFRvIII. Cancer Res. 1997. 57: 4130-40
32. Wikstrand CJ, Reist CJ, Archer GE, Zalutsky MR, Bigner DD. The class III variant of the epidermal growth factor receptor (EGFRvIII): Characterization and utilization as an immunotherapeutic target. J Neurovirol. 1998. 4: 148-58
33. Wood JR, Green SB, Shapiro WR. The prognostic importance of tumor size in malignant gliomas: A computed tomographic scan study by the Brain Tumor Cooperative Group. J Clin Oncol. 1988. 6: 338-43
34. Zehri AH, Ramey W, Georges JF, Mooney MA, Martirosyan NL, Preul MC. Neurosurgical confocal endomicroscopy: A review of contrast agents, confocal systems, and future imaging modalities. Surg Neurol Int. 2014. 5: 60-