- Department of Neurosurgery, Keio University School of Medicine, Shinjuku, Tokyo
Correspondence Address:
Ryosuke Tomio
Department of Neurosurgery, Keio University School of Medicine, Shinjuku, Tokyo
DOI:10.4103/2152-7806.193929
Copyright: © 2016 Surgical Neurology International This is an open access article distributed under the terms of the Creative Commons Attribution-NonCommercial-ShareAlike 3.0 License, which allows others to remix, tweak, and build upon the work non-commercially, as long as the author is credited and the new creations are licensed under the identical terms.How to cite this article: Ryosuke Tomio, Takenori Akiyama, Takayuki Ohira, Kazunari Yoshida. Comparison of effectiveness between cork-screw and peg-screw electrodes for transcranial motor evoked potential monitoring using the finite element method. 11-Nov-2016;7:
How to cite this URL: Ryosuke Tomio, Takenori Akiyama, Takayuki Ohira, Kazunari Yoshida. Comparison of effectiveness between cork-screw and peg-screw electrodes for transcranial motor evoked potential monitoring using the finite element method. 11-Nov-2016;7:. Available from: http://surgicalneurologyint.com/surgicalint_articles/comparison-effectiveness-cork%e2%80%91screw-peg%e2%80%91screw-electrodes-transcranial-motor-evoked-potential-monitoring-using-finite-element-method/
Date of Submission
26-Nov-2015
Date of Acceptance
07-Apr-2016
Date of Web Publication
11-Nov-2016
Abstract
Background:Intraoperative monitoring of motor evoked potentials by transcranial electric stimulation is popular in neurosurgery for monitoring motor function preservation. Some authors have reported that the peg-screw electrodes screwed into the skull can more effectively conduct current to the brain compared to subdermal cork-screw electrodes screwed into the skin. The aim of this study was to investigate the influence of electrode design on transcranial motor evoked potential monitoring. We estimated differences in effectiveness between the cork-screw electrode, peg-screw electrode, and cortical electrode to produce electric fields in the brain.
Methods:We used the finite element method to visualize electric fields in the brain generated by transcranial electric stimulation using realistic three-dimensional head models developed from T1-weighted images. Surfaces from five layers of the head were separated as accurately as possible. We created the “cork-screws model,” “1 peg-screw model,” “peg-screws model,” and “cortical electrode model”.
Results:Electric fields in the brain radially diffused from the brain surface at a maximum just below the electrodes in coronal sections. The coronal sections and surface views of the brain showed higher electric field distributions under the peg-screw compared to the cork-screw. An extremely high electric field was observed under cortical electrodes.
Conclusion:Our main finding was that the intensity of electric fields in the brain are higher in the peg-screw model than the cork-screw model.
Keywords: Finite element method, screw, transcranial electric stimulation, transcranial motor evoked potential
INTRODUCTION
Intraoperative monitoring of motor evoked potentials (MEPs) by transcranial electric stimulation (TES) is popular in neurosurgery for monitoring motor function preservation.[
Therefore, we performed visualization of the electric field in the brain during tMEP monitoring using realistic finite element (FE) models generated from standard brain magnetic resonance images (MRI). The usefulness of this method for evaluating the electric field in the cortex during therapeutic transcranial direct current stimulation (tDCS) has been reported,[
In the present work, we estimated differences in effectiveness between the cork-screw electrode, peg-screw electrode, and cortical electrode to produce electric fields in the brain.
MATERIALS AND METHODS
Realistic three-dimensional head model creation and electrode placement
The realistic 3D head models created in this study were developed from International Consortium for Brain Mapping (ICBM) T1-weighted images obtained from BrainWeb (
We created four models using 1 × 1 × 1 mm3 resolution images: The “cork-screws model,” “1 peg-screw model,” “peg-screws model,” and “cortical electrode model” [
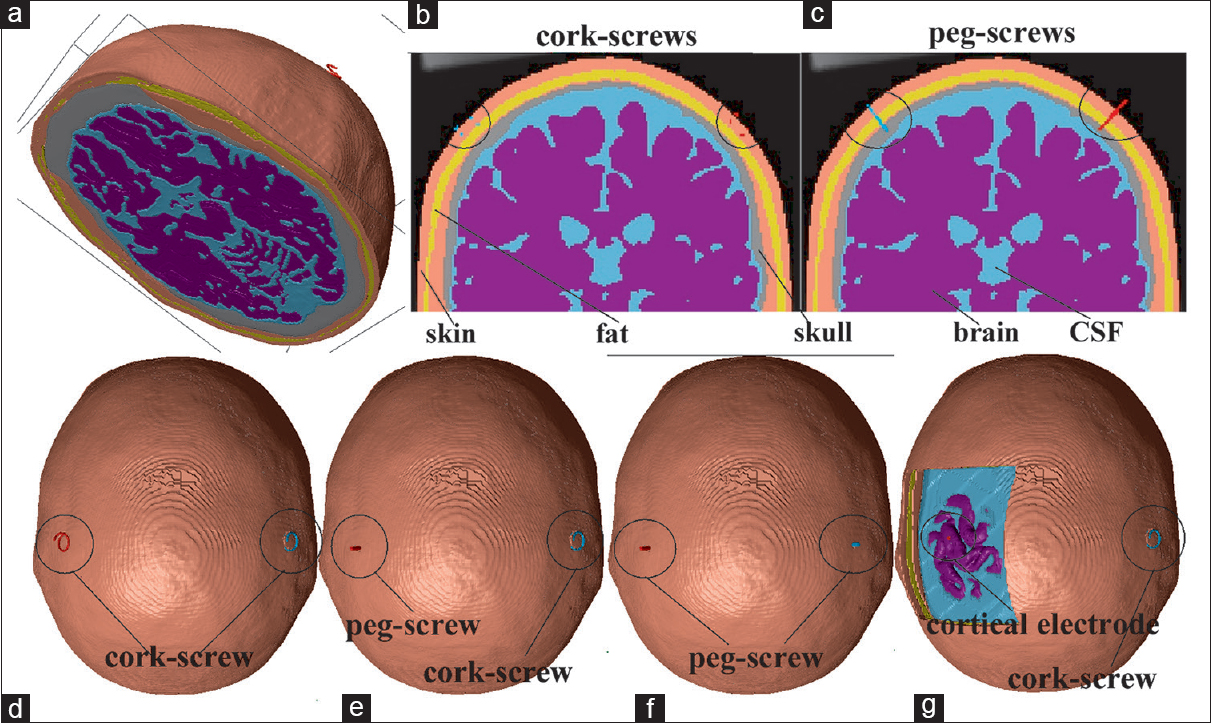
Figure 1
Three-dimensional model of the “cork-screws model” (a). The coronal section view of the “cork-screws model” (b) and the “peg-screws model” (c). Superior aspect of the “cork-screws model” (d), “1 peg-screw model” (e), “peg-screws model” (f), and “cortical electrode model” (g) are presented starting from the left
Screw electrodes were created by computer-aided design (CAD). Cork-screw electrodes were designed to imitate a popular design. The diameter of the helix was 10 mm, the pitch 4 mm, and the needle diameter was 0.6 mm for 2 turns (720°) of the helix. The cork-screw electrode was perpendicularly inserted into the skin to a depth of 1 turn (4 mm, 360°). It did not penetrate the subcutaneous fat layer.
The peg-screw electrode was made as a simple cylinder. Its diameter was 2.5 mm and the length of long axis was 20 mm. The peg-screw electrode was perpendicularly inserted into the skin and the subcutaneous fat layer. The tip of the peg-screw electrode was stuck into the skull, 3 mm from the CSF [
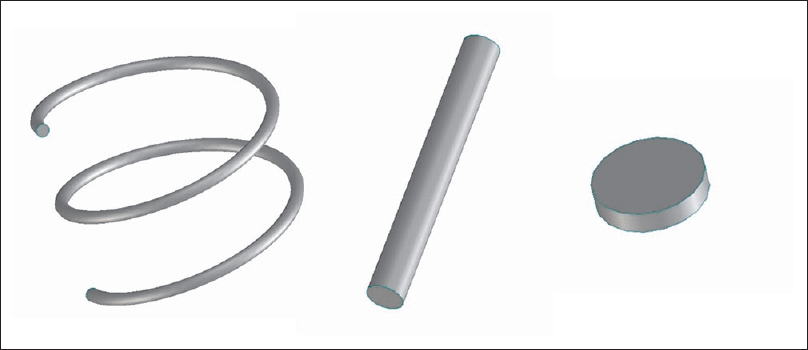
Both the electrodes were placed on the scalp at sites C3 and C4 (based on the international 10–20 system). The anode was the peg-screw and the cathode was the cork-screw in the “1 peg-screw model” because the anode was more effective to stimulate the motor cortex in tMEP monitoring. A skin-flap and bone layer over the hand motor cortex were removed in the “cortical electrode model.” CSF layer was partially removed to expose the hand motor cortex from the surface of the CSF layer. These procedures were performed using the 3D processing tool in ScanIP to erase a part of each layer. The cortical electrode was created using ScanIP. The disk-shaped cortical electrode was 5 mm in diameter and 1–2 mm thick. The cortical electrode was placed on the hand motor cortex.
The standard triangulated language (STL) data of the electrodes were imported to Scan IP using Scan CAD+ (©Simpleware Ltd, Exeter, United Kingdom). The locations of the electrodes were consistent across all the models. When the cork-screw electrode masks were converted to 1 × 1 × 1 voxels, these masks were minimally dilated in order to maintain continuity.
Tissue conduction properties and calculations by comsol multiphysics
All tissue layers were modeled as homogeneous and isotropic with respect to electrical conductivity and permittivity based on data from the Human organs property database for computing simulation (
The FE mesh exported by Scan IP was read into Comsol Multiphysics (version 4.4, Comsol AB, Stockholm, Sweden). The electric field was calculated statically using the DC application mode of the AC/DC module in the Comsol, which solved Laplace's equation for the electric potential. The boundary conditions assumed the following: (1) Uniform inward current flow applied to the distal surface of the anode electrode; (2) ground applied to the distal surface of the cathode electrode; (3) injected current set to 100 mA because 100 mA TES usually ignites both the upper and lower extremity MEPs simultaneously; and (4) all other external boundaries were insulated. The calculation by Comsol Multiphysics took less than 120 min for the 1 × 1 × 1 mm3 resolution models using a Corei7-4710 CPU and 32 GB of RAM.
Analysis of the results
We focused on the electric field plotted on the cross-sections and brain surface in each model. A coronal section that contained both the electrodes was made. The magnitude of the electric field was estimated in all models. Both the magnitude of the component of the electrical field perpendicular to the brain interface (pE) were estimated in surface studies of each model. Although the perpendicular component is negative where the field is inward to the surface and positive where the field is outward to the surface, we plotted the absolute values of the perpendicular component in our surface studies. All surface studies of the electric field were smoothed by replacing the value at each node with the average values in the neighboring triangles. The electric field values of all cross-section studies were visualized by a color scale with a range from 0 V/m (blue) to 60 V/m (red). The average and maximum values of the electric field in the brain were calculated by Comsol Multiphysics. These values were compared to estimate the electric field distribution among the models. In addition, potential differences between the anode and cathode as the “terminal voltage” were calculated to compare the total impedance of each model.
Limitations of the models
All the layers in our models were represented as isotropic; however, these layers are in fact anisotropic. A recent report suggested that a single layer isotropic representation of the skull may perform well provided that the conductivity is chosen to be the radial conductivity of the skull.[
The shunting effect of the metal head frame was not taken into account in this study. The head frame works as a shunt and was shown to decrease the magnitude of the electric field in a 2D study of the brain.[
Limitations because of the resolution and contrast of the ICBM T1-weighted images (1 × 1 × 1 mm3) along with technical limitations and simplifications associated with the segmentation of the layers and the mesh generation also may affect the accuracy of the electric field estimation. However, the impact of these effects was limited because the main aim of our study was to reveal differences of electrodes during neurosurgery using relative estimation among the various models.
We analyzed the electric field statically using the DC application mode, but the temporal variation of the electric field in the head during practical transcranial stimulation would be that of the stimulus waveform. According to the Quasi-static approximation, this distribution of the electric field is also valid for AC stimulation if the capacitive currents are negligible.[
RESULTS
Electric field distribution in the “normal head model” and the effect of skull deformation in neurosurgery
The electric field in all four models was studied. The electric field distribution in all models is shown in
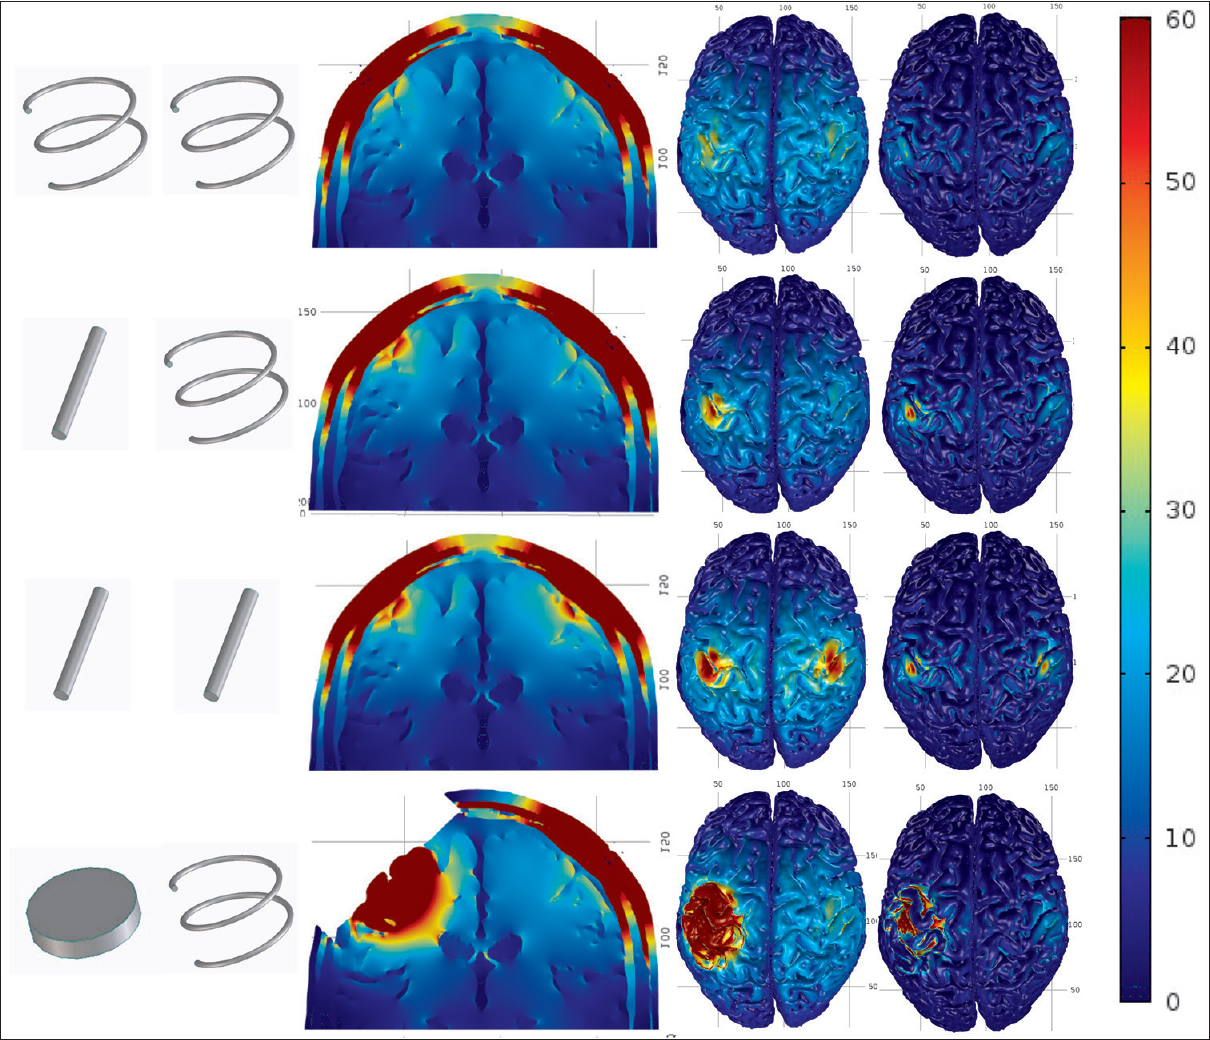
Figure 3
The electric fields in all models. From the top: “cork-screws model,” “1 peg-screw model,” “peg-screws model,” and “cortical electrode model.” Seen are the electrodes used in each model, the coronal section, the surface view of the electric field, and the perpendicular component (pE) starting from the left. The color scale ranges from 0 V/m (blue) to 60 V/m (red)
The electric field in the brain radially diffused out from the surface with the maximum values noted just below the electrodes in the coronal sections. The coronal sections and surface views of the brain showed higher electric field distributions just under the peg-screws (>50 V/m) compared to the cork-screws (<40 V/m). However, the extent of higher electric fields (>50 V/m) under the peg-screw electrode was narrow, especially for the pE which was <1 cm in diameter. These findings indicated that the peg-screws effectively concentrated higher electric fields on the brain just under the electrodes. An extremely high electric field was observed broadly under the cortical electrode. There was a large difference between the cortical electrodes and others.
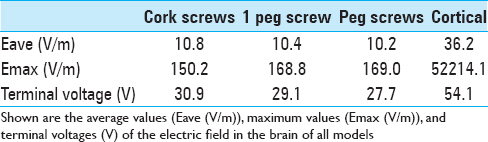
Higher maximum values of the electric field in the brain were observed in the “peg-screws model” (169 V/m) compared with the “cork-screws model” (150 V/m). The average value of the electric field in the brain of the “cork-screw model” was slightly higher than the “peg-screw model,” but these values were almost equal. The “cortical electrode model” showed three to four times higher average values (36.2 V/m) than screw models (≒10 V/m) and an extremely high maximum value (52,200 V/m). These results are also consistent with coronal sections and surface views. The terminal voltage was highest in the “cortical electrode model” (54.1 V). The terminal voltage in the “cork-screws model” (30.9 V) was slightly higher than that in the “peg-screw model” (27.7 V). The terminal voltage reflected the resistance between the electrodes.
DISCUSSION
The amount of TES that can be delivered to the brain is not clear. Subdermal cork-screw electrodes are popular to pass electrical stimulation current, however, most of the current is spread laterally through the scalp because of the skull's high resistance. Thus, only a small percentage (~20%) of the current seemed to pass into the brain.[
Watanabe et al.[
However, no study has directly compared the mean threshold stimulation intensity of the peg-screw and cork-screw electrodes, likely because of the difficulty of such studies in humans. Both types of electrodes must be placed in the same place, but this is difficult and would be invasive to the skin locally, if performed. Therefore, FE model is reasonable to compare the effectiveness of these electrode types, and this is the first report that numerically visualized the electric field in the brain with both types of electrodes.
Our coronal and surface sections indicated that peg-screw electrodes generated a higher electric field distribution than the cork-screw at the cortex just under the electrode. The pE to the cortical surface seems to be more important since pyramidal cells tend to align perpendicular to the brain surface,[
The maximum value of the electric field was also higher in the peg-screw model than the cork-screw. The average value of the electric field is proportional to the sum of the electric field in the brain. The average values were almost equal among the three models using both screw electrode types. These findings indicated that the peg-screw electrodes could concentrate the electric field to the cortex just under the electrode and reduce lateral spread of current during TES. Thus, the peg-screw electrodes must improve the accuracy of tMEP monitoring, especially in facial and lower cranial nerve tMEP. These cranial nerve tMEP monitoring (ex: facial MEP and lower cranial nerve MEP) are easily impaired by lateral spread of erectric current during transcranial electric stimulation (TES), because facial muscle can be directly stimulated by lateral spread current. However, so far no report in the literature has investigated the clinical evidence of effectiveness in these cranial nerve tMEP monitoring, and further investigation of the peg-screw in clinical settings is required.
The peg-screw is more effective to stimulate the cortex and can improve accuracy of the tMEP monitoring, however, there is a little risk in percutaneous placement of peg-screws. Percutaneous placement of peg-screws can be performed without skin incision after general anesthesia induction. A micro-drill is useful to drill a pilot hole in the skull prior to peg-screw insertion. The peg-screw is then percutaneously drilled into the skull by screwdriver. Although this procedure can be safely performed with no major complications in our limited experience, percutaneous drilling of the peg-screw electrode must be carefully performed to minimize the risk of skull penetration. Placement of peg-screws only on the side where the motor cortex is to be stimulated is reasonable for risk reduction. If the placement of peg-screw can be performed directly to the skull over the motor cortex during craniotomy procedures, it can be minimally-invasive and safe.
All of the electric current is passed through the cortex just under the cortical electrode in cortical electric stimulation. An extremely high maximum electric field value was observed just under the contact surface of cortical electrodes on the brain. The stimulation intensity must be adjusted to just higher than threshold to prevent local injury. Our results showed that the average value in the “cortical electrode model” is 3–4 times higher than that in other TES models, and it was consistent with a prior report.[
The terminal voltage was highest in the “cortical electrode model.” This is due to a decrease in current passing through the CSF layer as a high conductive shunt because terminal voltage reflects total resistance between electrodes. Higher terminal voltage in the “cork-screws model” compared to the “peg-screw model” would reflect decreased resistance from the skull using the peg-screw.
CONCLUSIONS
Our main finding was that the intensity of electric fields in the brain is higher in the peg-screw model than the cork-screw model. The peg-screw electrode can concentrate the electric field to the cortex just under the electrode more efficiently than the cork-screw electrode during TES. Use of the peg-screw must be effective in stimulating the cortex and reduces lateral current spread during TES, especially in facial and lower cranial nerve MEP monitoring.
Financial support and sponsorship
Nil.
Conflicts of interest
There are no conflicts of interest.
References
1. Goto T, Muraoka H, Kodama K, Hara Y, Yako T, Hongo K. Intraoperative monitoring of motor evoked potential for the facial nerve using a cranial peg-screw electrode and a “threshold-level” stimulation method. Skull Base. 2010. 20: 429-34
2. Holdefer RN, Sadleir R, Russell MJ. Predicted current densities in the brain during transcranial electrical stimulation. Clin Neurophysiol. 2006. 117: 1388-97
3. Lee JJ, Kim YI, Hong JT, Sung JH, Lee SW, Yang SH. Intraoperative monitoring of motor-evoked potentials for supratentorial tumor surgery. J Kor Neurosurg Soc. 2014. 56: 98-102
4. Miranda PC, Mekonnen A, Salvador R, Ruffini G. The electric field in the cortex during transcranial current stimulation. Neuroimage. 2013. 70: 48-58
5. Motoyama Y, Kawaguchi M, Yamada S, Nakagawa I, Nishimura F, Hironaka Y. Evaluation of combined use of transcranial and direct cortical motor evoked potential monitoring during unruptured aneurysm surgery. Neurol Med Chir (Tokyo). 2011. 51: 15-22
6. Pechstein U, Cedzich C, Nadstawek J, Schramm J. Transcranial high-frequency repetitive electrical stimulation for recording myogenic motor evoked potentials with the patient under general anesthesia. Neurosurgery. 1996. 39: 335-43
7. Rampersad SM, Stegeman DF, Oostendorp TF. Single-layer skull approximations perform well in transcranial direct current stimulation modeling. IEEE Trans Neural Syst Rehabil Eng. 2013. 21: 346-53
8. Ranck JB. Which elements are excited in electrical stimulation of mammalian central nervous system: A review. Brain Res. 1975. 98: 417-40
9. Szelényi A, Bueno de Camargo A, Flamm E, Deletis V. Neurophysiological criteria for intraoperative prediction of pure motor hemiplegia during aneurysm surgery. Case report. J Neurosurg. 2003. 99: 575-8
10. Szelényi A, Langer D, Kothbauer K, De Camargo AB, Flamm ES, Deletis V. Monitoring of muscle motor evoked potentials during cerebral aneurysm surgery: Intraoperative changes and postoperative outcome. J Neurosurg. 2006. 105: 675-81
11. Szelényi A, Hattingen E, Weidauer S, Seifert V, Ziemann U. Intraoperative motor evoked potential alteration in intracranial tumor surgery and its relation to signal alteration in postoperative magnetic resonance imaging. Neurosurgery. 2010. 67: 302-13
12. Tanaka S, Tashiro T, Gomi A, Takanashi J, Ujiie H. Sensitivity and specificity in transcranial motor-evoked potential monitoring during neurosurgical operations. Surg Neurol Int. 2011. 2: 111-
13. Tomio R, Akiyama T, Horikoshi T, Ohira T, Yoshida K. Visualization of the electric field evoked by transcranial electric stimulation during a craniotomy using the finite element method. J Neurosci Methods. 2015. 256: 157-67
14. Watanabe K, Watanabe T, Takahashi A, Saito N, Hirato M, Sasaki T. Transcranial electrical stimulation through screw electrodes for intraoperative monitoring of motor evoked potentials. Technical note. J Neurosurg. 2004. 100: 155-60
15. Zhou HH, Kelly PJ. Transcranial electrical motor evoked potential monitoring for brain tumor resection. Neurosurgery. 2001. 48: 1075-