- Department of Neurosurgery, Nara Medical University, Kashihara, Nara Prefecture, Japan.
DOI:10.25259/SNI_14_2020
Copyright: © 2020 Surgical Neurology International This is an open-access article distributed under the terms of the Creative Commons Attribution-Non Commercial-Share Alike 4.0 License, which allows others to remix, tweak, and build upon the work non-commercially, as long as the author is credited and the new creations are licensed under the identical terms.How to cite this article: Koji Omoto, Ichiro Nakagawa, Fumihiko Nishimura, Shuichi Yamada, Yasushi Motoyama, Hiroyuki Nakase. Computed tomography perfusion imaging after aneurysmal subarachnoid hemorrhage can detect cerebral vasospasm and predict delayed cerebral ischemia after endovascular treatment. 08-Aug-2020;11:233
How to cite this URL: Koji Omoto, Ichiro Nakagawa, Fumihiko Nishimura, Shuichi Yamada, Yasushi Motoyama, Hiroyuki Nakase. Computed tomography perfusion imaging after aneurysmal subarachnoid hemorrhage can detect cerebral vasospasm and predict delayed cerebral ischemia after endovascular treatment. 08-Aug-2020;11:233. Available from: https://surgicalneurologyint.com/?post_type=surgicalint_articles&p=10195
Date of Submission
12-Jan-2020
Date of Acceptance
14-Jul-2020
Date of Web Publication
08-Aug-2020
Abstract
Background: Endovascular treatment (ET) can improve angiographic cerebral vasospasm (CV) after aneurysmal subarachnoid hemorrhage, but was unrelated to clinical outcomes in previous analyses. Appropriate detection of CV and precise indications for ET are required. This study investigated whether changes in computed tomography perfusion (CTP) parameter can determine indications for ET in CV and predict its effectiveness.
Methods: Participants comprised 140 patients who underwent neck clipping or coil embolization. CTP was performed a week after aneurysmal treatment or when clinical deterioration had occurred. Patients were divided into ET and non-ET groups by propensity score matching. In addition, the ET group was divided into subgroups with and without new cerebral infarction (CI). All CTP images in the three groups were retrospectively investigated qualitatively and quantitatively. CI was diagnosed from CT at 3 months postoperatively.
Results: Of the 121 patients examined, 15 patients (11%) needed ET. In qualitative analysis, all ET group patients displayed extension of time-to-peak (TTP) at the region of vasospastic change, regardless of the presence of CI. Quantitative analysis showed significant decreases in cerebral blood volume (P P P P P
Conclusion: CTP in the vasospastic period may be an indication for ET and predict the effectiveness of ET for CV to improve clinical outcomes.
Keywords: Aneurysmal SAH, Cerebral vasospasm, CT perfusion, Endovascular fasudil injection
INTRODUCTION
Delayed cerebral ischemia (DCI) -induced by cerebral vasospasm (CV) after aneurysmal subarachnoid hemorrhage (aSAH) is an important factor associated with poor prognosis.[
MATERIALS AND METHODS
Patient population
From January 2014 to September 2017, a total of 140 consecutive patients who underwent neck clipping or coil embolization of ruptured aneurysm within 48 h after the onset of aSAH were enrolled. Diagnostic CT angiography (CTA) was performed during the first 12 h after admission for detection of the aneurysm site. The main factors for selecting endovascular coil embolization were the difficulty of clip application and an aneurysm located in the posterior circulation. Patients with any of the following conditions were excluded: Hunt and Kosnik (H-K) Grade V; head trauma; renal disease; or congestive heart failure. In total, 121 patients were included in the present study [
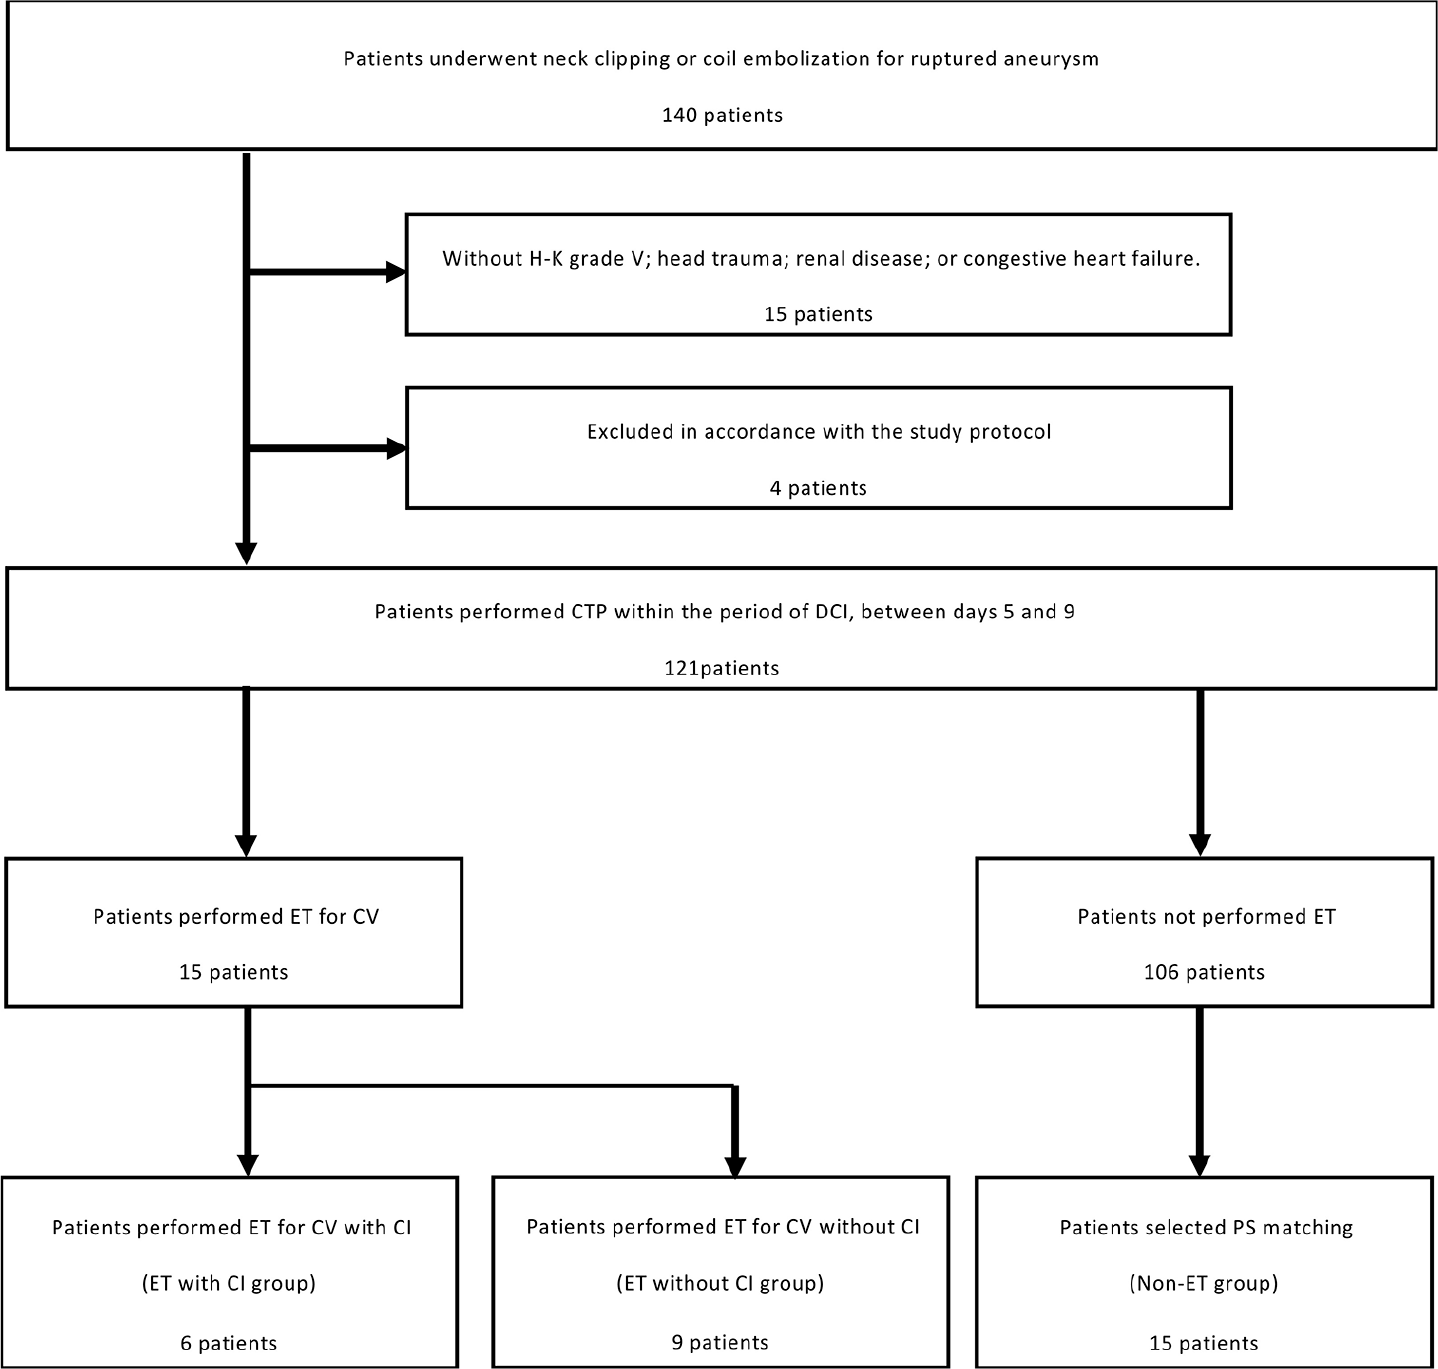
Patients were divided into a group in which ET was performed for CV (ET group) and a group in which no CV suitable for ET was identified (non-ET group). Patients in the non-ET group were selected by applying propensity score (PS) matching using SPSS version 25 software (IBM, Tokyo, Japan) adjusted for age, sex, aneurysm location, and clinical SAH data (H-K grade and Fisher grade) as a control group in contrast to the ET group. CI due to CV was diagnosed from CT at performed 3 months postoperatively, and the ET group was then divided into subgroups with and without CI.
Perioperative management and ET
All patients remained normovolemic and normotensive after SAH. The protocol to prevent CV in our institute was described previously.[
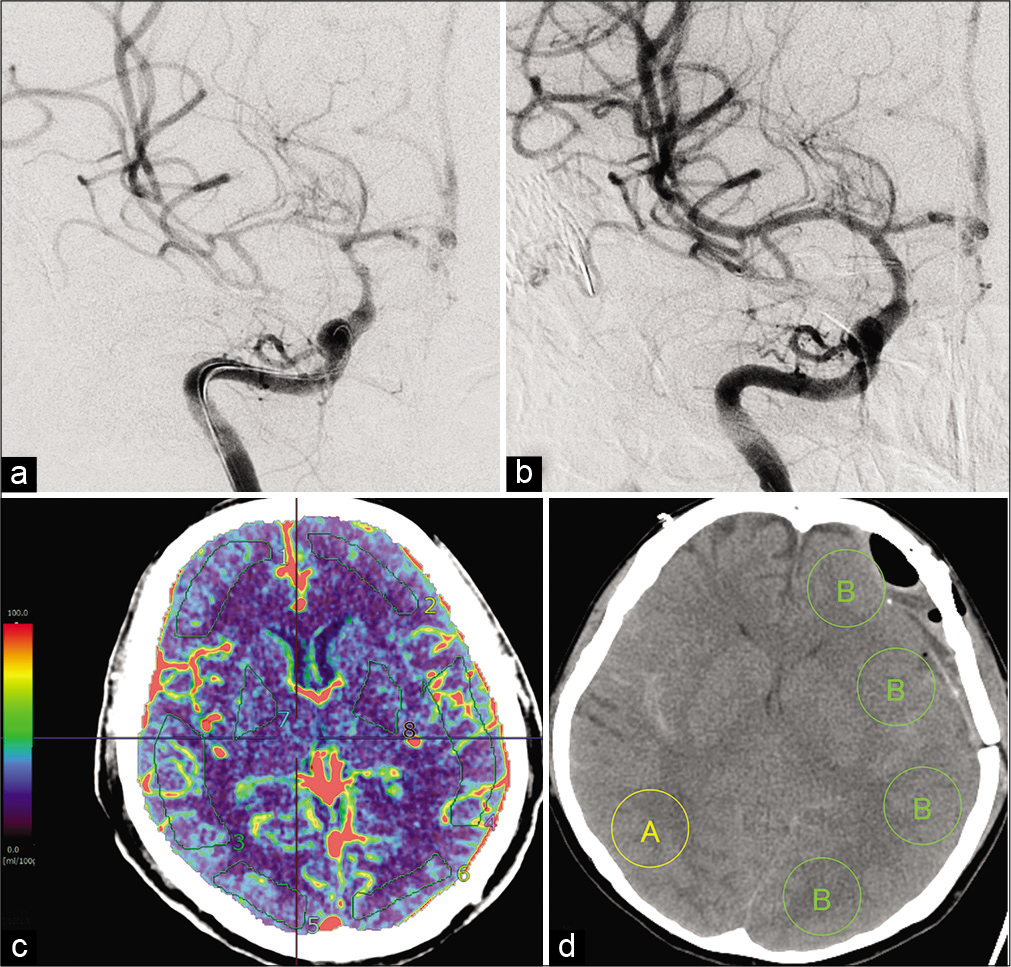
Figure 2:
(a) Digital subtraction angiography (DSA) shows vasospastic change in the right middle cerebral artery (MCA) (black arrowhead). (b) Vasospastic change in the right MCA is improved after intra-arterial injection of fasudil hydrochloride (IAFC) (black arrowhead). (c) Computed tomography perfusion (CTP) is acquired with a Synapse Vincent 4D perfusion image. Eight regions of interest (ROIs) are measured quantitatively in each patient with aSAH within days 5–9 postictus. (d) An ROI showing vasospastic change on DSA is categorized as a vasospastic region (A), and the ROI contralateral to the side of the ischemic region is categorized as a non-vasospastic region (B). In the non-vasospastic region, four values are obtained from the ROI and averaged to reduce bias. The ratio A/B is then calculated.
CTP protocol
CTP was performed for all cases during the typical time period for DCI, between postoperative days 5 and 9, in asymptomatic patients and on the same day that clinical deterioration or change in TCD occurred in symptomatic patients to screen for CV. If CV was recognized, CTA was performed and DSA was performed consecutively, as mentioned above. A standard scanning protocol for CTP is applied at our institution using a 64-slice multidetector-row CT scanner (SOMATOM Definition Flash; Siemens Healthineers, Tokyo, Japan). CTP data were acquired with a periodic spiral approach (adaptive 4-dimensional spiral mode) of 30 periodic spiral mode scans of the brain with cranial-caudal coverage of 100 mm in z-axis (sampling time per volume, 1.5 s). We intravenously administered 35 mL of iodine contrast medium (Iopamiron 370; Bayer Schering Pharma, Berlin, Germany) at a flow rate of 5 mL/s followed by a 25-mL saline push at the same rate. The CTP scan (80 kV; 140 mAs; rotation time, 0.28 s; collimation, 32 × 1.2 mm; scan time, 1.5 s; cycle time, 1.5 s) was started after an individual delay time adjusted with a test bolus. Delay time was calculated as a rise in the time-density curve ‒3 s with injection of 10 mL of iodine contrast medium at a flow rate of 5 mL/s added to 20 mL of saline at the same flow rate as the test bolus.
Image and data analysis
All CT perfusion images and DS angiograms were interpreted by an experienced senior neurosurgeon (I.N.). CT perfusion images were analyzed qualitatively using rainbow color scale maps of cerebral blood flow (CBF), cerebral blood volume (CBV), mean transit time (MTT), and time-to-peak (TTP). Next, postprocessing of the acquired images into CBF, CBV, and MTT maps was performed quantitatively using Synapse VINCENT 4D perfusion (Fujifilm, Tokyo, Japan). This software uses a deconvolution method, which is considered the most accurate for low-contrast injection rates. The postprocessing protocol was selected for all patients according to recommended guidelines (ASIST-Japan 2006).[
Study outcomes
The primary outcome was CTP parameter changes to determine indications for ET of CV and predict its effectiveness in the populations of non-ET, ET with CI, and ET without CI. Qualitative and quantitative evaluations in CTP were thus performed for three groups (non-ET, ET with CI, and ET without CI). Exclusion criteria were CTP performed after ET or >9 days after ictus and CI already confirmed on CTP. CI was diagnosed from CT performed 3 months postoperatively.
Statistical analysis
Statistical comparisons among groups were conducted using one-way analysis of variance. Where indicated, individual comparisons were performed using Student’s t test. Statistical significance was ascribed to the data for values of P < 0.05.
RESULTS
Study population characteristics
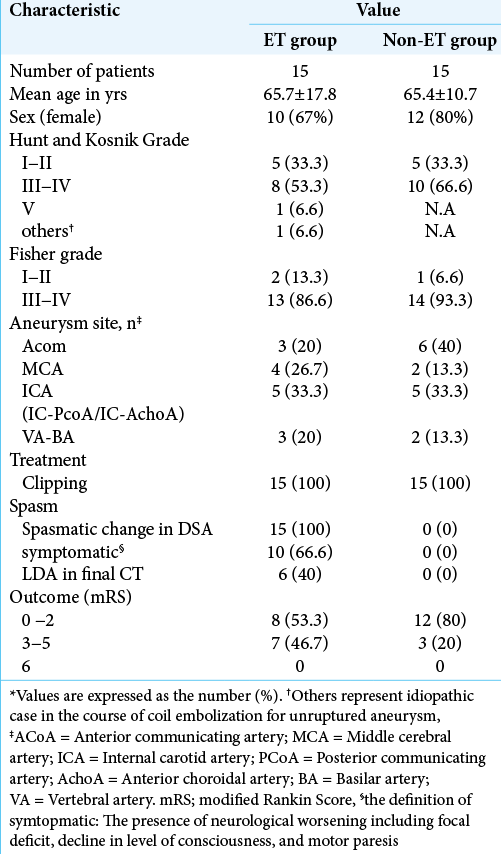
A total of 121 patients (83 women and 38 men) were examined and CTP parameters after aSAH were measured. The mean age of patients was 67 years (range, 28–84 years). Fifteen patients (12%) showed ET and received IAFC for CV and none received PTA. Fifteen patients from the non- ET group as controls were selected by PS matching, as mentioned in [
Qualitative analysis and quantitative analysis of CTP parameters
On qualitative analysis, all patients in the ET group showed extension of TTP in the region of vasospastic change on DSA, regardless of the presence of CI [
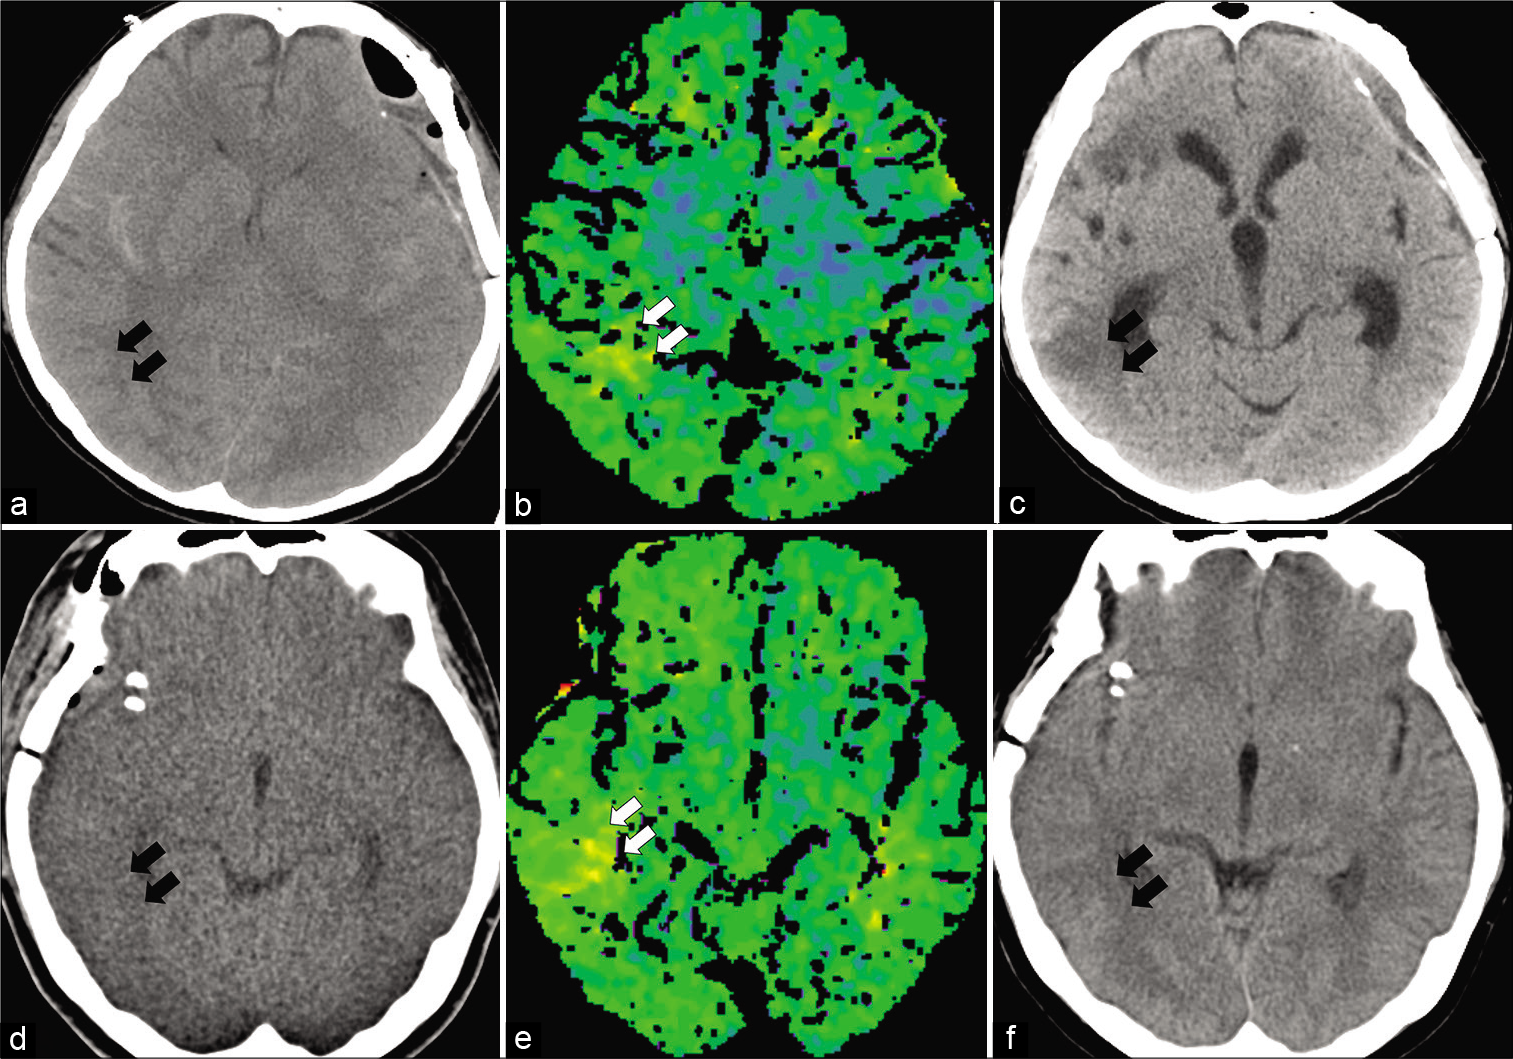
Figure 3:
Clinical progression in illustrative cases from the ET with cerebral infarction (CI) subgroup (a-c) and the ET without CI subgroup (d-f) using CT after operation and after 1 month and TTP image within days 5–9. All data for TTP in the ET group show qualitative extension. (a) A patient in the ET with CI subgroup shows no apparent infarction on CT at 1 day postoperatively. (b) TTP from the same patient indicates extension of TTP in the region of vasospastic change on DSA (white arrow). (c) Despite perioperative management including IAFC, the region showing extension of TTP finally develops cerebral infarction with CT after 1 month (black arrow). (d) A patient from the ET with no CI subgroup shows slight low-density changes in the right temporal lobe on CT the day after the operation (black arrow). (e) The image from TTP in this patient indicates extension of TTP in the region of vasospastic change on DSA (white arrow). (f) Under perioperative management including IAFC, the region showing extension of TTP still shows no cerebral infarction on CT after 1 month (black arrow).
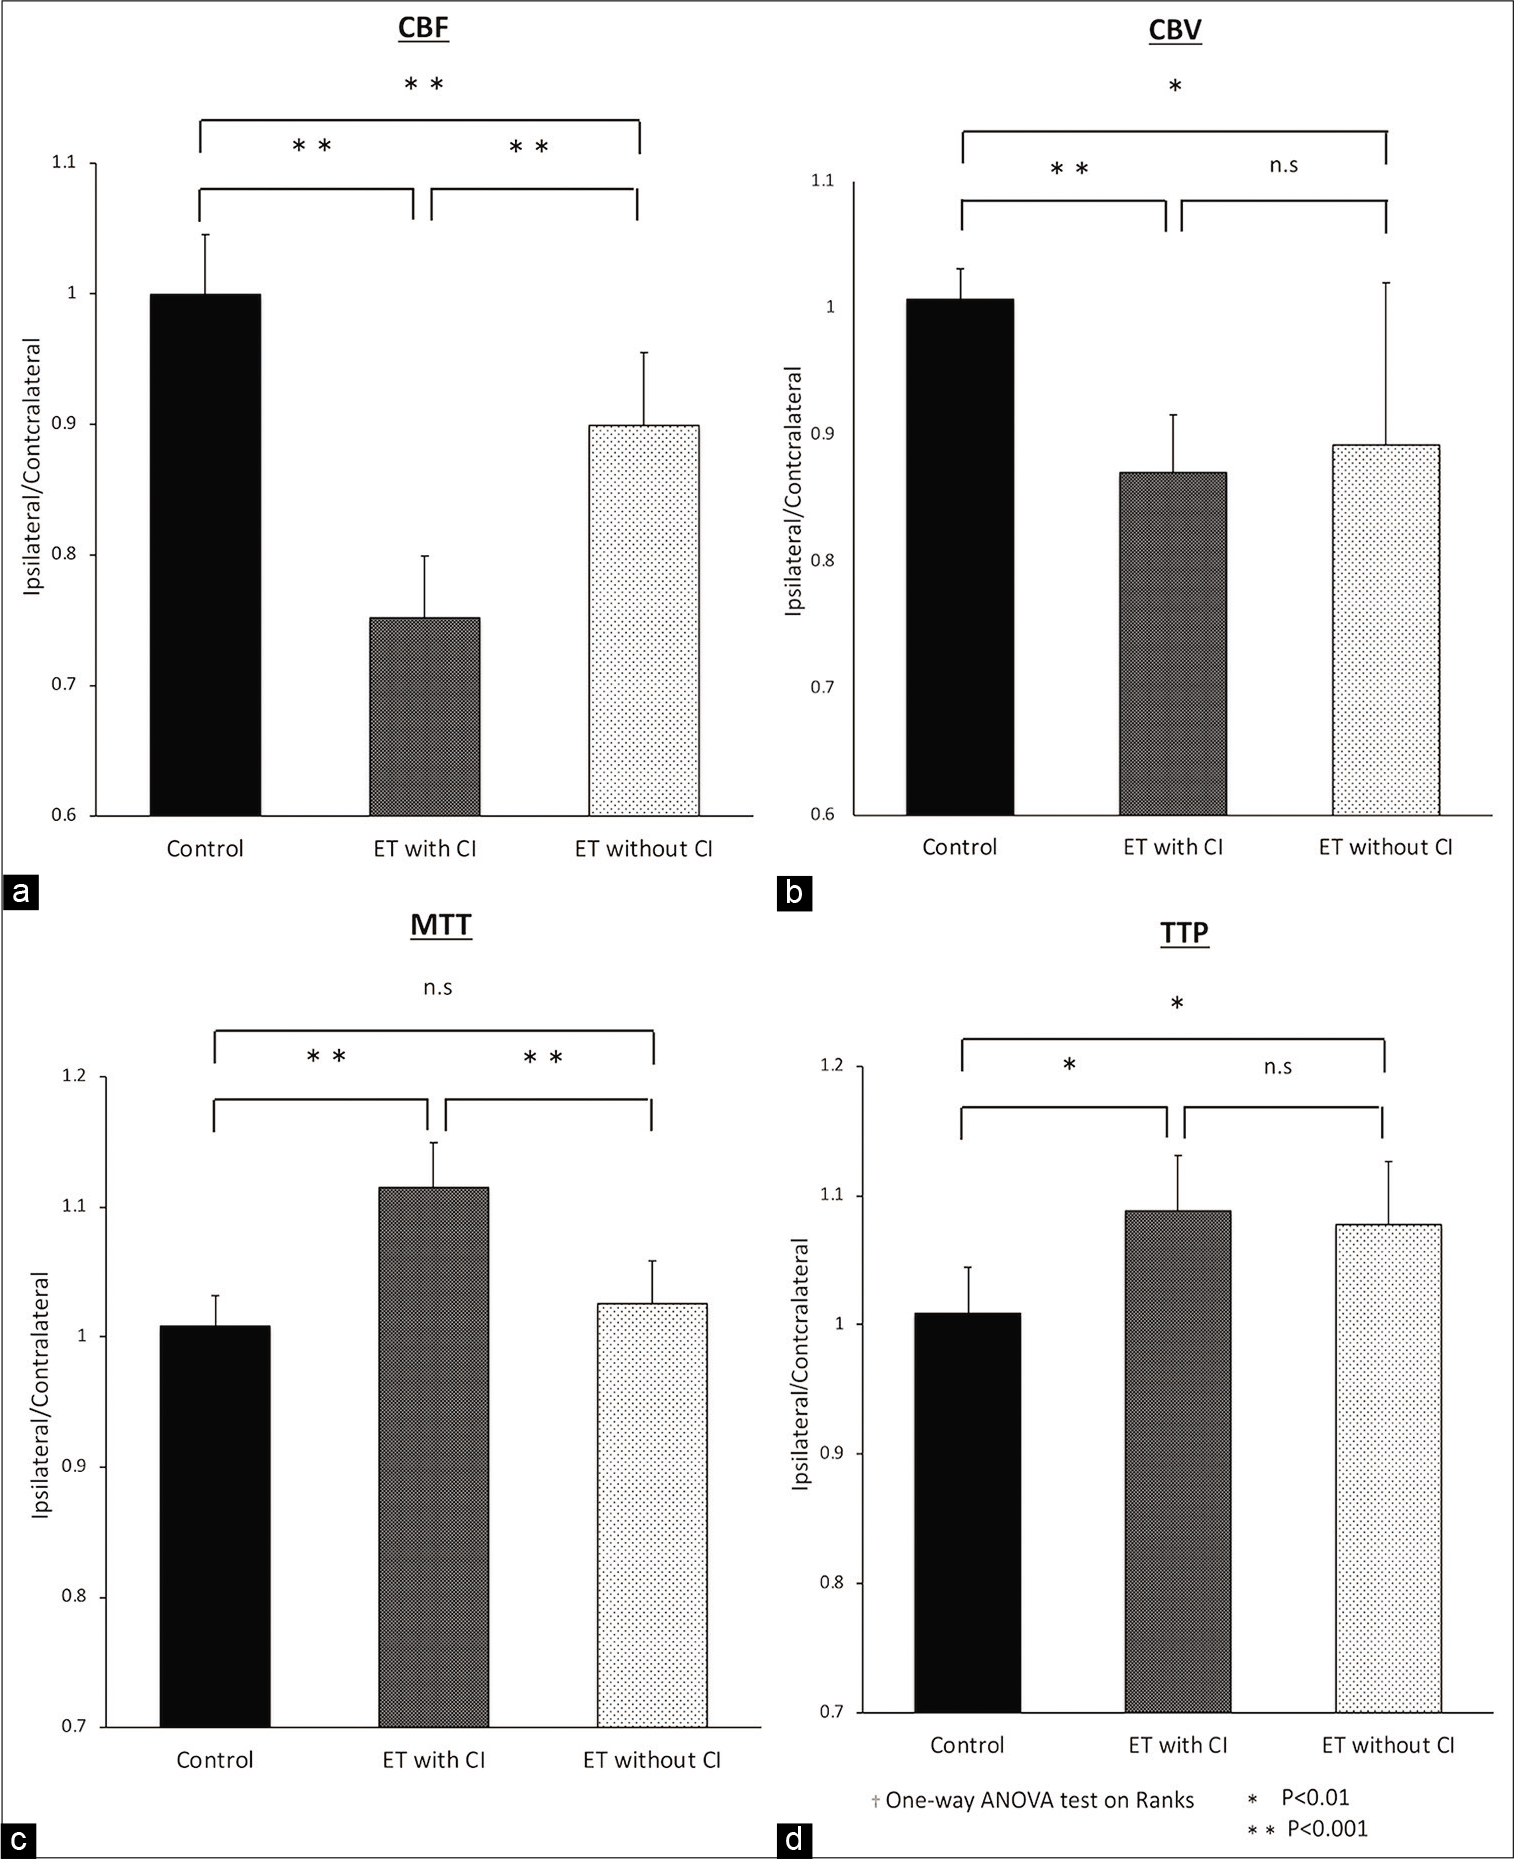
Figure 4:
The ratio of A and B from ROIs calculated from Synapse Vincent 4D perfusion images as quantitative analysis is shown for three groups, a Non-ET group as control, an ET with CI group and an ET without CI group. The non-ET group was selected by PS matching. Comparison of CBF (a), CBV (b), MTT (c), and TTP (d) between the non-ET group and the ET w/wo CI group indicates significant decreases in CBV (P < 0.01) and CBF (P < 0.001) and extension in TTP (P < 0.01). Comparison between the ET with CI group and the ET without CI group shows significant decreases in CBF (P < 0.001) and extension in MTT (P < 0.001).
DISCUSSION
Strength of this study was its position as the first study to investigate indications and prediction of effectiveness for ET using CTP within the temporal window for DCI. Significant decreases in CBV and CBF and extension in TTP were seen in the ET group compared with the non-ET group in quantitative CTP parameter analysis. The results indicate that changes in these parameters influence the efficacy of ET. In addition, significant decreases in CBF and extension in MTT were found in the ET with CI group compared with the ET without CI group. The result indicates that further deterioration of these parameters would lead to poor outcomes irrespective of ET. In short, these results indicate that detection of CV using CTP in the vasospastic period can be useful for comprehending hemodynamic conditions under CV and may predict the effectiveness of ET for CV to improve clinical outcomes.
Can CTP on days 5–9 raise awareness of DCI?
Suitable and timely comprehension of CV after aSAH improves outcomes in terms of DCI, but assessment of neurological findings and identification of impending DCI is difficult in cases of severe aSAH. DCI mostly occurs 4–14 days after hemorrhage.[
Can ET improve CV and outcomes?
The efficacy of ET for the treatment of CV following aSAH remains debatable. A meta-analysis showed that intra- arterial injection of vasodilators enabled angiographic response in 89% of patients and clinical improvement in 63%. That study indicated that IAFC leads to robust angiographic response and fair rates of neurological response and good clinical outcomes. However, a previous study reported that IAFC or the combination of IAFC and PTA did not improve clinical outcomes.[
Can CTP judge indications for ET and predict effectiveness?
Kunze et al. performed a retrospective ROI-based CTP study of 53 patients with aSAH who underwent CTP 3 times on day 3 or 4, day 6 or 7, and day 9 or 10 and additionally at any other time point when CV was suspected. TTP was the parameter showing the highest sensitivity for detection of CV.[
Limitations of the study
We have to acknowledge several limitations in the present study. First, quantitative analysis in this investigation yielded significant results, but the number of clinical samples was small. Second, the study was a retrospective analysis with PS matching, not a prospective study. Third, the existence of CI was judged from CT, not MRI. Detection of CI due to CV was related to the size of the infarction, which would also have led to neurological deterioration related to final outcome. Fourth, the CTP protocol and ROIs introduced potential sources of bias. CTP was affected by the CT device and CTP protocol used in each institution. Results from previous ROI-based quantitative analyses are thus not necessarily more widely applicable to other hospitals. To reduce bias, our study calculated the ratio of the vasospastic region to of non-vasospastic region. This value may prove helpful for comparisons with other studies. CTP parameters of symptomatic vasospastic region could be underestimated by asymptomatic vasospasm in symmetrical contralateral regions. Systemic hemodynamic changes parallel to development of CV could affect CTP parameters even in contralateral asymptomatic side. SAH is known to lead to spontaneous and progressive elevations in mean arterial blood pressure, which could affect CTP parameters.[
CONCLUSION
CTP in the vasospastic period after aSAH was effective for comprehending the condition of dramatic changes in CV. Decreases in CBV and CBF and extension of TTP may provide indications for ET to improve clinical outcomes.
Statement of ethics
All study patients signed a written authorization allowing access to their medical records for research purposes, and our institutional review board approved the research protocol (No. 2035).
Declaration of patient consent
The authors certify that they have obtained all appropriate patient consent.
Financial support and sponsorship
Nil.
Conflicts of interest
There are no conflicts of interest.
References
1. Barker FG, Ogilvy CS. Efficacy of prophylactic nimodipine for delayed ischemic deficit after subarachnoid hemorrhage: A metaanalysis. J Neurosurg. 1996. 84: 405-14
2. Bederson JB, Connolly ES, Batjer HH, Dacey RG, Dion JE, Diringer MN. Guidelines for the management of aneurysmal subarachnoid hemorrhage: A statement for healthcare professionals from a special writing group of the stroke council, American heart association. Stroke. 2009. 40: 994-1025
3. Cremers CH, van der Schaaf IC, Wensink E, Greving JP, Rinkel GJ, Velthuis BK. CT perfusion and delayed cerebral ischemia in aneurysmal subarachnoid hemorrhage: A systematic review and meta-analysis. J Cereb Blood Flow Metab. 2014. 34: 200-7
4. Eskridge JM, McAuliffe W, Song JK, Deliganis AV, Newell DW, Lewis DH. Balloon angioplasty for the treatment of vasospasm: Results of first 50 Cases. Neurosurgery. 1998. 42: 510-6
5. Fontana J, Scharf J, Weiss C, Schmieder K, Barth M. The spontaneous arterial blood pressure rise after aneurysmal subarachnoid hemorrhage-a biphasic phenomenon. Clin Neurol Neurosurg. 2015. 137: 22-7
6. Hickmann AK, Langner S, Kirsch M, Baldauf J, Muller C, Khaw A. The value of perfusion computed tomography in predicting clinically relevant vasospasm in patients with aneurysmal subarachnoid hemorrhage. Neurosurg Rev. 2013. 36: 267-78
7. Hosmann A, Rauscher S, Wang WT, Dodier P, Bavinzski G, Knosp E. Intra-arterial papaverine-hydrochloride and transluminal balloon angioplasty for neurointerventional management of delayed-onset post-aneurysmal subarachnoid hemorrhage vasospasm. World Neurosurg. 2018. 119: e301-12
8. Kassell NF, Torner JC, Haley EC, Jane JA, Adams HP, Kongable GL. The international cooperative study on the timing of aneurysm surgery. Part. 1. Overall management results. J Neurosurg. 1990. 73: 18-36
9. Killeen RP, Gupta A, Delaney H, Johnson CE, Tsiouris AJ, Comunale J. Appropriate use of CT perfusion following aneurysmal subarachnoid hemorrhage: A Bayesian analysis approach. AJNR Am J Neuroradiol. 2014. 35: 459-65
10. Killeen RP, Mushlin AI, Johnson CE, Comunale JP, Tsiouris AJ, Delaney H. Comparison of CT perfusion and digital subtraction angiography in the evaluation of delayed cerebral ischemia. Acad Radiol. 2011. 18: 1094-100
11. Konczalla J, Seifert V, Beck J, Guresir E, Vatter H, Raabe A. Outcome after Hunt and Hess grade V subarachnoid hemorrhage: A comparison of pre-coiling era (1980-1995) versus post-ISAT era (2005-2014). J Neurosurg. 2018. 128: 100-10
12. Kunze E, Pham M, Raslan F, Stetter C, Lee JY, Solymosi L. Value of perfusion CT, transcranial doppler sonography, and neurological examination to detect delayed vasospasm after aneurysmal subarachnoid hemorrhage. Radiol Res Pract. 2012. 2012: 231206
13. Nakagawa I, Hironaka Y, Nishimura F, Takeshima Y, Matsuda R, Yamada S. Early inhibition of natriuresis suppresses symptomatic cerebral vasospasm in patients with aneurysmal subarachnoid hemorrhage. Cerebrovasc Dis. 2013. 35: 131-7
14. Nakagawa I, Yokoyama S, Omoto K, Takeshima Y, Matsuda R, Nishimura F. w-3 fatty acids ethyl esters suppress cerebral vasospasm and improve clinical outcome following aneurysmal subarachnoid hemorrhage. World Neurosurg. 2017. 99: 457-64
15. Nogueira RG, Jadhav AP, Haussen DC, Bonafe A, Budzik RF, Bhuva P. Thrombectomy 6 to 24 hours after stroke with a mismatch between deficit and infarct. N Engl J Med. 2018. 378: 11-21
16. Ratsep T, Asser T. Cerebral hemodynamic impairment after aneurysmal subarachnoid hemorrhage as evaluated using transcranial Doppler ultrasonography: Relationship to delayed cerebral ischemia and clinical outcome. J Neurosurg. 2001. 95: 393-401
17. Saito A, Inoue M, Kon H, Imaruoka S, Basaki K, Midorikawa H. Effectiveness of intraarterial administration of fasudil hydrochloride for preventing symptomatic vasospasm after subarachnoid hemorrhage. Acta Neurochir Suppl. 2015. 120: 297-301
18. Sanelli PC, Anumula N, Johnson CE, Comunale JP, Tsiouris AJ, Riina H. Evaluating CT perfusion using outcome measures of delayed cerebral ischemia in aneurysmal subarachnoid hemorrhage. AJNR Am J Neuroradiol. 2013. 34: 292-8
19. Sashida J, Nagata K, Kawamoto S, Abe T, Mukasa A, Imaizumi Y. Angioplasty for the infusion of fasudil hydrochloride to treat cerebral symptomatic vasospasm. Interv Neuroradiol. 1999. 5: 133-6
20. Sokolowski JD, Chen CJ, Ding D, Buell TJ, Raper DM, Ironside N. Endovascular treatment for cerebral vasospasm following aneurysmal subarachnoid hemorrhage: Predictors of outcome and retreatment. J Neurointerv Surg. 2018. 10: 367-74
21. Tachibana E, Harada T, Shibuya M, Saito K, Takayasu M, Suzuki Y. Intra-arterial infusion of fasudil hydrochloride for treating vasospasm following subarachnoid haemorrhage. Acta Neurochir (Wien). 1999. 141: 13-9
22. van Gijn J, Kerr RS, Rinkel GJ. Subarachnoid haemorrhage. Lancet. 2007. 369: 306-18
23. Venkatraman A, Khawaja AM, Gupta S, Hardas S, Deveikis JP, Harrigan MR. Intra-arterial vasodilators for vasospasm following aneurysmal subarachnoid hemorrhage: A meta-analysis. J Neurointerv Surg. 2018. 10: 380-7
24. Wintermark M, Albers GW, Alexandrov AV, Alger JR, Bammer R, Baron JC. Acute stroke imaging research roadmap. Stroke. 2008. 39: 1621-8
25. Wintermark M, Ko NU, Smith WS, Liu S, Higashida RT, Dillon WP. Vasospasm after subarachnoid hemorrhage: Utility of perfusion CT and CT angiography on diagnosis and management. AJNR Am J Neuroradiol. 2006. 27: 26-34