- Department of Neurosurgery, Showa University School of Medicine, Tokyo, Japan.
DOI:10.25259/SNI_298_2021
Copyright: © 2021 Surgical Neurology International This is an open-access article distributed under the terms of the Creative Commons Attribution-Non Commercial-Share Alike 4.0 License, which allows others to remix, tweak, and build upon the work non-commercially, as long as the author is credited and the new creations are licensed under the identical terms.How to cite this article: Yuta Kobayashi, Yosuke Sato, Tatsuya Sugiyama, Tohru Mizutani. Intraoperative epileptogenic network visualization using gamma oscillation regularity correlation analysis in epilepsy surgery. 07-Jun-2021;12:254
How to cite this URL: Yuta Kobayashi, Yosuke Sato, Tatsuya Sugiyama, Tohru Mizutani. Intraoperative epileptogenic network visualization using gamma oscillation regularity correlation analysis in epilepsy surgery. 07-Jun-2021;12:254. Available from: https://surgicalneurologyint.com/surgicalint-articles/10873/
Date of Submission
21-Mar-2021
Date of Acceptance
29-Apr-2021
Date of Web Publication
07-Jun-2021
Abstract
Background: We have recently demonstrated that gamma oscillation (30–70 Hz) regularity (GOR) analysis accurately localized epileptogenic focus using intraoperative electrocorticographic data. In this report, we assessed whether GOR correlation analysis could depict epileptogenic networks intraoperatively. Dual foci in temporal lobe epilepsy without hippocampal structural abnormalities are difficult to diagnose. Using our GOR correlation analysis, we aimed to intraoperatively visualize such dual foci and epileptogenic networks.
Case Description: A 56-year-old man suffered from pharmacoresistant focal impaired awareness seizures. Magnetic resonance imaging demonstrated an 8 × 12-mm cavernoma in the right inferior temporal gyrus without any structural changes in the hippocampus. Since ictal semiology indicated a high probability of epileptogenicity in the right hippocampus, we reached the hippocampus using a transsylvian approach and assessed intraoperative GOR correlation analysis in the lateral temporal lobe where the cavernoma was located and the hippocampus, simultaneously. High GORs suggestive of epileptogenicity were identified in both the lateral temporal lobe and the hippocampus. Furthermore, they were connected using GOR correlation networks. When the high GOR locations in the lateral temporal lobe and the cavernoma were removed, high GORs and those networks were found within the hippocampus only. After additional hippocampal transection, high GORs and these networks were absent. The patient became seizure-free after the surgery.
Conclusion: Our GOR correlation analysis may be a powerful tool for intraoperative evaluation of epileptogenic networks in epilepsy surgery.
Keywords: Cavernoma, Dual pathology, Epileptogenic network, Gamma oscillation regularity, Sample entropy, Temporal lobe epilepsy
INTRODUCTION
We have previously demonstrated that gamma oscillation regularity (GOR) in electrocorticographic (ECoG) data is strongly related to epileptogenicity and that quantifying the GOR using sample entropy analysis allows for epileptic focus visualization and detailed algorithms.[
CLINICAL PRESENTATION
A 56-year-old man had intractable epileptic seizures for more than 3 years. His symptoms included motor automatisms (hand movements) of focal impaired awareness seizures. Brain MRI revealed a cavernoma measuring 8 × 12 mm in the right inferior temporal gyrus. Neither reduced hippocampal volume nor enlarged temporal horn, which is a typical structural finding of mesial temporal lobe epilepsy, could be seen in fluid-attenuated inversion recovery sequence images [
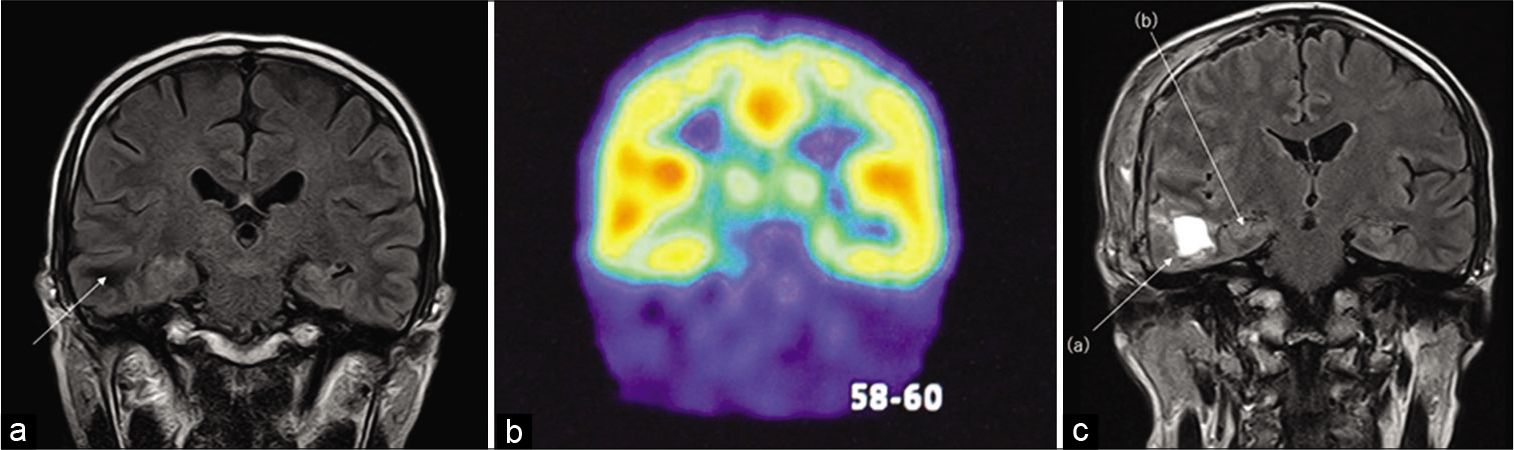
Figure 1:
(a) Pre-operative MRI of coronal section. Fluid-attenuated inversion recovery sequence revealed 8 × 12 mm cavernoma in the right inferior temporal gyrus (arrow). Neither reduced hippocampal volume nor enlarged temporal horn, which are typical structural findings of mesial temporal lobe epilepsy, could be seen. (b) Iomazenil-single-photon emission computed tomography showed decreased accumulation in the right mesial temporal lobe (c) The postoperative brain MRI showed complete resection of cavernoma (a) and hippocampal transection (b).
Under general anesthesia, the body was placed in the supine position, and the head position was fixed with a rotation of 30° to the left side. We placed the 2 × 4 strip electrodes (Unique Medical Co., Ltd., Tokyo, Japan) on the right temporal lobe where the cavernoma lesion was well covered, and the 1 × 4 strip electrodes on the hippocampus, using a transsylvian approach. We obtained ECoG recordings and performed GOR correlation analysis (1) before resection, (2) after cavernoma resection, and (3) after hippocampal transection, respectively. In hippocampal transection, the hippocampal head to the hippocampal tail was cut subpially toward the dorsal side of the hippocampus, and the parahippocampal gyrus was dissected from the innominate sulcus. Postoperative brain MRI showed complete resection of the cavernoma and hippocampal transection [
ECoG data recordings
The ECoG data were recorded using a Nihon Kohden Neurofax EEG system (Nihon Kohden, Tokyo, Japan) with a bandpass filter from 0.16 to 300 Hz with a sampling rate of 1 kHz. A 60-Hz notch filter was applied to all channels, and the sensitivity was between 30 and 100 μV/mm according to the amplitudes of the background activities and epileptic discharges. The recordings were obtained using a reference electrode placed on the forehead. All selected ECoG epochs were inspected to ensure that they were not contaminated by artifacts.
GOR correlation analysis
The detailed algorithm for GOR analysis using the sample entropy method was described in our previous studies.[
Sij is the covariance of electrodes i and j, and Si is the standard deviation of electrode i. In the network diagram, the threshold was set to 0.7 in this case. The edge was placed between node i and node j when rij ≥ 0.7. We weighted the threshold between 0.7 and 1 linearly with the thickness of the edge. To visually assess the GOR, we color-coded the average GOR over 2 min. These procedures were performed using a custom program developed in cooperation with EFken Inc., Tokyo, Japan.
RESULTS
We performed ECoG recordings and GOR correlation analysis simultaneously in the lateral temporal lobe and hippocampus. Before resection, the ECoG showed synchronized spikes in the lateral temporal lobe and hippocampus and isolated spikes in the hippocampus [
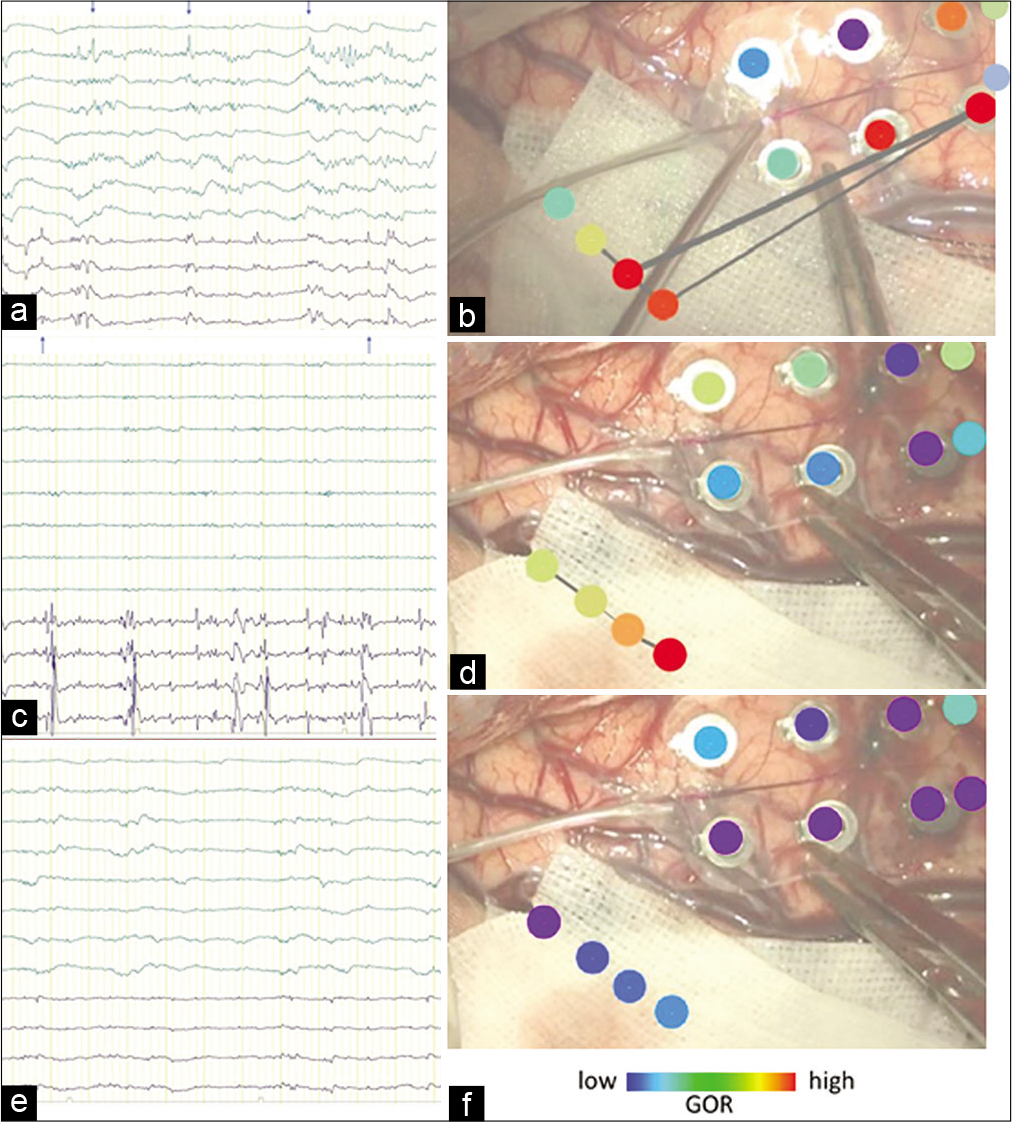
Figure 2:
(a) Electrocorticography (ECoG) before cavernoma resection. The upper eight lows are the 2 × 4 strip electrodes on the right temporal lobe, the lower 4 lows are the 1 × 4 strip electrodes on the right hippocampus. ECoG showed synchronized spikes (↑) in the lateral temporal lobe and hippocampus, and isolated spikes (↓) in the hippocampus. (b) Intraoperative photograph of the brain surface before cavernoma resection. Upper: The right six dots are the 2 × 4 strip electrodes, and the lower-left four dots are the 1 × 4 strip electrodes. They are colored using a gamma oscillation regularity (GOR) map. The red dotted circle in the GOR map shows the area with a significantly high GOR, while the blue dotted circle in the GOR map shows the area with a low GOR. Both electrodes exhibited a high GOR. The lines connecting the dots show the electrical network analyzed by the GOR. (c) ECoG after cavernoma resection. The negative spikes in the 2 × 4 strip electrodes disappeared. On the 1 × 4 strip electrodes, synchronized positive spikes disappeared, but a negative spike remained. (d) Intraoperative photograph of the brain surface after cavernoma resection. The 2 × 4 strip electrodes showed decreased GOR, whereas a high GOR remained in the 1 × 4 strip electrodes. Networks were found only in the hippocampus. (e) ECoG after cavernoma resection. The negative spikes observed in the 1 × 4 strip electrodes disappeared. (f) Intraoperative photograph of the brain surface after hippocampal transection. The GOR decreased in the hippocampus, and the network was absent.
DISCUSSION
Arriving at a decision on which cerebral regions produce seizures is important in epilepsy surgery. This enables us to plan a detailed surgical strategy, which leads to excellent postoperative outcomes and minimal neurological deficits. Intraoperative ECoG has been widely used to localize epileptic activity for the management of cavernomas presenting with drug-resistant epilepsy.[
Video EEG monitoring can reveal the correlation between semiology and ictal EEG. The limitation of this method is that the ictal stage is the only stage in which the seizure onset zone can be detected, and waiting time for seizures is needed. Our GOR analysis requires only a few tens of seconds or at most a minute of interictal EEG data and can be used intraoperatively.[
The transsylvian approach is a basic approach for the management of mesial temporal lobe epilepsy.[
CONCLUSION
Our GOR correlation analysis is a powerful tool for intraoperative evaluation of epileptogenic networks and enables us to perform better surgery for seizure control.
Data availability statement
The raw data supporting this article will be made available by the authors, without undue reservation.
Declaration of patient consent
Institutional Review Board (IRB) permission obtained for the study.
Financial support and sponsorship
JSPS KAKENHI Grant Number JP 20K09356.
Conflicts of interest
There are no conflicts of interest.
References
1. Bartolomei F, Lagarde S, Wendling F, McGonigal A, Jirsa V, Guye M. Defining epileptogenic networks: Contribution of SEEG and signal analysis. Eplepsia. 2017. 58: 1131-47
2. Bartolomei F, Wendling F, Chauvel P. The concept of an epileptogenic network in human partial epilepsies. Neurochirurgie. 2008. 54: 174-84
3. Chavez M, Valencia M, Navarro V. Functional modularity of background activities in normal and epileptic brain networks. Phys Rev Lett. 2010. 104: 118701
4. Lachaux JP, Lutz A, Rudrauf D. Estimating the time-course of coherence between single-trial brain signals: An introduction to wavelet coherence. Neurophysiol Clin. 2002. 32: 157-74
5. McKhann GM, Schoenfeld-McNeill J, Born DE, Haglund MM, Ojemann GA. Intraoperative hippocampal electrocorticography to predict the extent of hippocampal resection in temporal lobe epilepsy surgery. J Neurosurg. 2000. 93: 44-52
6. Patil AA, Andrews RV. Nonresective hippocampal surgery for epilepsy. World Neurosurg. 2010. 74: 645-9
7. San-Juan D, Díaz-Nuñez IC, Ojeda-Baldéz M. Utility of electrocorticography in the surgical treatment of cavernomas presenting with pharmacoresistant epilepsy. Epileptic Disord. 2014. 16: 245-60
8. Sato Y, Ochi A, Mizutani T, Otsubo H. Low entropy of interictal gamma oscillations is a biomarker of the seizure onset zone in focal cortical dysplasia Type II. Epilepsy Behav. 2019. 96: 155-9
9. Sato Y, Wong SM, Iimura Y, Ochi A, Doesburg SM, Otsubo H. Spatiotemporal changes in regularity of gamma oscillations contribute to focal ictogenesis. Sci Rep. 2017. 7: 9362
10. Stefan H, Da Silva FH. Epileptic neuronal networks: Methods of identification and clinical relevance. Front Neurol. 2013. 4: 8
11. Thornton R, Vulliemoz S, Rodionov R. Epileptic networks in focal cortical dysplasia revealed using electroencephalography-functional magnetic resonance imaging. Ann Neurol. 2011. 70: 822-37
12. Tripathi M, Garg A, Gaikwad S. Intraoperative electrocorticography in lesional epilepsy. Epilepsy Res. 2010. 89: 133-41
13. Uda T, Morino M, Ito H, Minami N, Hosono A, Nagai T. Transsylvian hippocampal transection for mesial temporal lobe epilepsy: Surgical indications, procedure, and postoperative seizure and memory outcomes. J Neurosurg. 2013. 119: 1098-110
14. van Gompel JJ, Rubio J, Cascino GD, Worrell GA, Meyer FB. Electrocorticography-guided resection of temporal cavernoma: Is electrocorticography warranted and does it alter the surgical approach?. J Neurosurg. 2009. 110: 1179-85
15. Wendling F, Ansari-Asl K, Bartolomei F. From EEG signals to brain connectivity: A model-based evaluation of interdependence measures. J Neurosci Methods. 2009. 183: 9-18
16. Yaşargil MG, Krayenbühl N, Roth P, Hsu SP, Yaşargil DC. The selective amygdalohippocampectomy for intractable temporal limbic seizures. J Neurosurg. 2010. 112: 168-85