- Department of Neurosurgery, All India Institute of Medical Sciences, Bibinagar, Hyderabad, Telangana, India
- Department of Radiology, Additional Professor, Department of Radio-Diagnosis, All India Institute of Medical Sciences, Bibinagar, Hyderabad, Telangana, India
- Department of Neurology, Nizam’s Institute of Medical Sciences, Hyderabad, Telangana, India.
Correspondence Address:
Rajesh Alugolu, Department of Neurosurgery, Nizam’s Institute of Medical Sciences, Hyderabad, Telangana, India.
DOI:10.25259/SNI_584_2021
Copyright: © 2021 Surgical Neurology International This is an open-access article distributed under the terms of the Creative Commons Attribution-Non Commercial-Share Alike 4.0 License, which allows others to remix, tweak, and build upon the work non-commercially, as long as the author is credited and the new creations are licensed under the identical terms.How to cite this article: Swapnil Kolpakwar1, Abhishek J. Arora2, S. Pavan1, Rukmini M. Kandadai3, Rajesh Alugolu1, M. Vijaya Saradhi1, Rupam Borgohain3. Volumetric analysis of subthalamic nucleus and red nucleus in patients of advanced Parkinson’s disease using SWI sequences. 27-Jul-2021;12:377
How to cite this URL: Swapnil Kolpakwar1, Abhishek J. Arora2, S. Pavan1, Rukmini M. Kandadai3, Rajesh Alugolu1, M. Vijaya Saradhi1, Rupam Borgohain3. Volumetric analysis of subthalamic nucleus and red nucleus in patients of advanced Parkinson’s disease using SWI sequences. 27-Jul-2021;12:377. Available from: https://surgicalneurologyint.com/surgicalint-articles/10993/
Date of Submission
10-Jun-2021
Date of Acceptance
29-Jun-2021
Date of Web Publication
27-Jul-2021
Abstract
Background: Parkinson’s disease is associated with significant changes in morphometry of subthalamic nucleus (STN); however, not much is known as the disease progresses. The aim of present study was to investigate the volume of STN and Red nucleus (RN) on 3T-magnetic resonance imaging (MRI) and its possible correlation with disease progression in advanced Parkinson’s disease patients.
Methods: Patients of advanced Parkinson’s disease were prospectively followed for clinical details, motor severity scores, and radiological evaluation. Volumes of the STN and RN were measured on susceptibility weighted imaging, coronal sections in 3T MRI and were correlated with demographic and clinical features.
Results: A total of 52 patients were included in our study. There were 42 (80.77%) males and 10 (19.23%) females. Mean age of onset of Parkinson’s disease was 49.48 + 10.90 years. Average duration of disease in the present cohort was 7.65 + 4.31 years. Average STN and RN volume were 103.46 + 21.17 mm3 and 321.73 + 67.66 mm3. Age of onset, disease duration and Unified Parkinson’s Disease Rating Scale Part III scores were not found to be associated with changes in STN Volumes. Weak positive trend was noted between RN volume and disease duration (Pearson cor. 0.204, P = 0.14). Patients in early-onset Parkinson’s disease group had significantly more volume of RN than patients in late-onset Parkinson’s disease group (P = 0.014).
Conclusion: Disease duration and early age of onset in Parkinson’s disease can be associated with increased RN volume. Volume of STN shows relatively no change even with disease progression.
Keywords: Disease duration, Parkinson’s disease, Red nucleus, Subthalamic nucleus, Volumetric analysis
INTRODUCTION
Parkinson’s disease (PD) manifests clinically with varying combinations of tremor, bradykinesia, rigidity, and other non-motor symptoms. Subthalamic nucleus (STN) has a major role in the pathophysiology of PD.[
The aim of the present study was to investigate the volume of STN and Red nucleus (RN) on 3T MRI susceptibility weighted imaging (SWI) sequences and its possible correlation with disease progression in patients with advanced PD.
MATERIALS AND METHODS
This prospective observational study was conducted in the Department of Neurosurgery, Neurology and Radiology from February 2019 to February 2020. Approval from Institutional Ethics Committee was taken. All consecutive patients admitted and undergoing STN-DBS for advanced PD were included in the study. Motor severity assessment was performed in all patients using Unified Parkinson’s Disease Rating Scale Part III (UPDRS III) scores in OFF state by a qualified UPDRS III specialist after depriving the patient of his dopaminergic medications for at least 12 h. Radiological evaluation included volumetric SWI sequences acquired in 3T MRI as a routine protocol. MR Scanner, image acquisition protocol, and methodology were uniform and were done in ON phase without any need for general anesthesia.
Data acquisition
SWI-Acquisitions
Gradient echo sequences, using the following parameters: 80 slices, Field-of-view (FoV) = 240 mm, FoV phase 88%, Repetition time/Echo time = 28/20 ms; flip angle of 15°, with fat suppression and flow compensation, resolution matrix of 352 × 248 with a slice thickness of 0.6 mm, AP and RL phase-encoding direction for axial and coronal orientation, respectively, were used for the acquisition. Acquisition time was 7 min and 14 s for acquiring each SWI dataset. The volumes of the STN and RN were measured on SWI coronal images by tracing the borders of the STN and RN manually on each slice and then were interpolated to calculate the volume. Use of axial sections and axial minimum intensity projection images was made, in cases, where margins of the nuclei were not clearly delineated on coronal images [

Volumes of the nuclei were correlated with demographic and clinical features. Statistical analysis was done using IBM Statistical Package for the Social Sciences trial version 22. P < 0.05 was considered significant.
RESULTS
Demography
A total of 52 patients were included in our study. There were 42 (80.77%) males and 10 (19.23%) females. Mean age of the patients was 57.13 + 9.81 years (Median −59, Range 39– 83 years). Maximum number of patients (n = 24, 46.15%) was in the age group of 60–70 years of age. There were 15 patients (28.85%) in the age group of 50–60 years of age. Mean age of onset of PD was 49.48 + 10.90 years. Average duration of disease in present cohort was 7.65 + 4.31 years. There were 14 (26.92%) patients who presented to us within 5 years of onset of disease. Twenty-three patients (44.23%) had disease duration of 6–10 years. There were 15 (28.85%) patients who presented with disease duration of more than 10 years. Twenty-four (46.15%) patients had disease onset before 50 years of age qualifying them for Early Onset Parkinson’s Disease (EOPD) group and 28 (53.85 %) patients had disease onset after 50 years of age, integrating them into Late Onset Parkinson’s disease (LOPD) group. Mean UPDRS III score in OFF state was 55.61 + 9.99 [

Volumetric analysis of STN
Volume of the right and left STN and RN was calculated from SWI sequences. None of the patients required any form of anesthesia for image acquisition. Average of volumes of nucleus from both sides was calculated. Mean right and left subthalamic volume was 106.15 + 23.60 mm3 and 100.76 + 21.76 mm3, respectively. Average STN volume was 103.46 + 21.17 mm3 with a range of 65–155 mm3 [

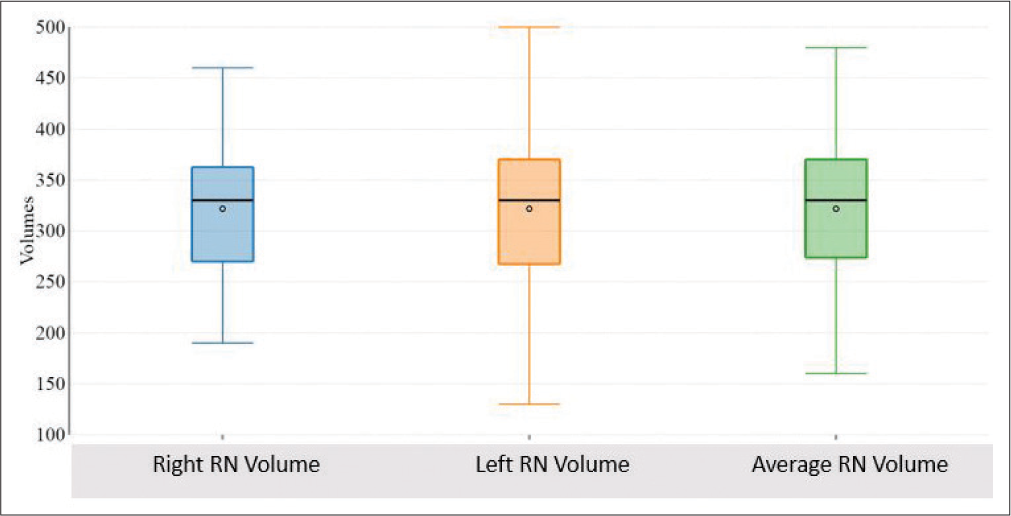
Volumetric analysis of RN
Mean right and left RN volume were 321.73 + 65.16 mm3 and 321.73 + 73.39 mm3. Average RN volume was 321.73 + 67.66 mm3 with a range of 160–480 mm3 [
Correlation of STN Volume with demography and clinical features
Parameters acquired through the volumetric analysis were compared with demographic and clinical features. Hemi-corporal UPDRS III was compared with contralateral STN and RN Volumes. No correlation was noted between age of patient and volume of RN. Disease duration was found to be positively correlated with STN volume but statistical significance was not seen. Overall, no difference related to gender was noticed, except in cases with disease duration of <5 years, males had significantly less STN volume than females (P = 0.046). STN volume did not differ in early and late onset PD group. No statistical significance was noted between UPDRS III in off state and STN volumes [

Figure 4:
Scatter plot showing correlation between STN Volume and (a) Age of onset, (b) Disease Duration, (c) UPDRS III, and (d) right STN Volume and Left Hemicorporal UPDRS III, (e) Left STN Volume and Right Hemicorporal UPDRS III. STN: Subthalamic nucleus, UPDRS III: Unified Parkinson’s disease rating scale part III.
Correlation of RN Volume with demography and clinical features
Weak positive trend was noted between volume of RN and disease duration (Pearson cor. 0.204, P = 0.14) [
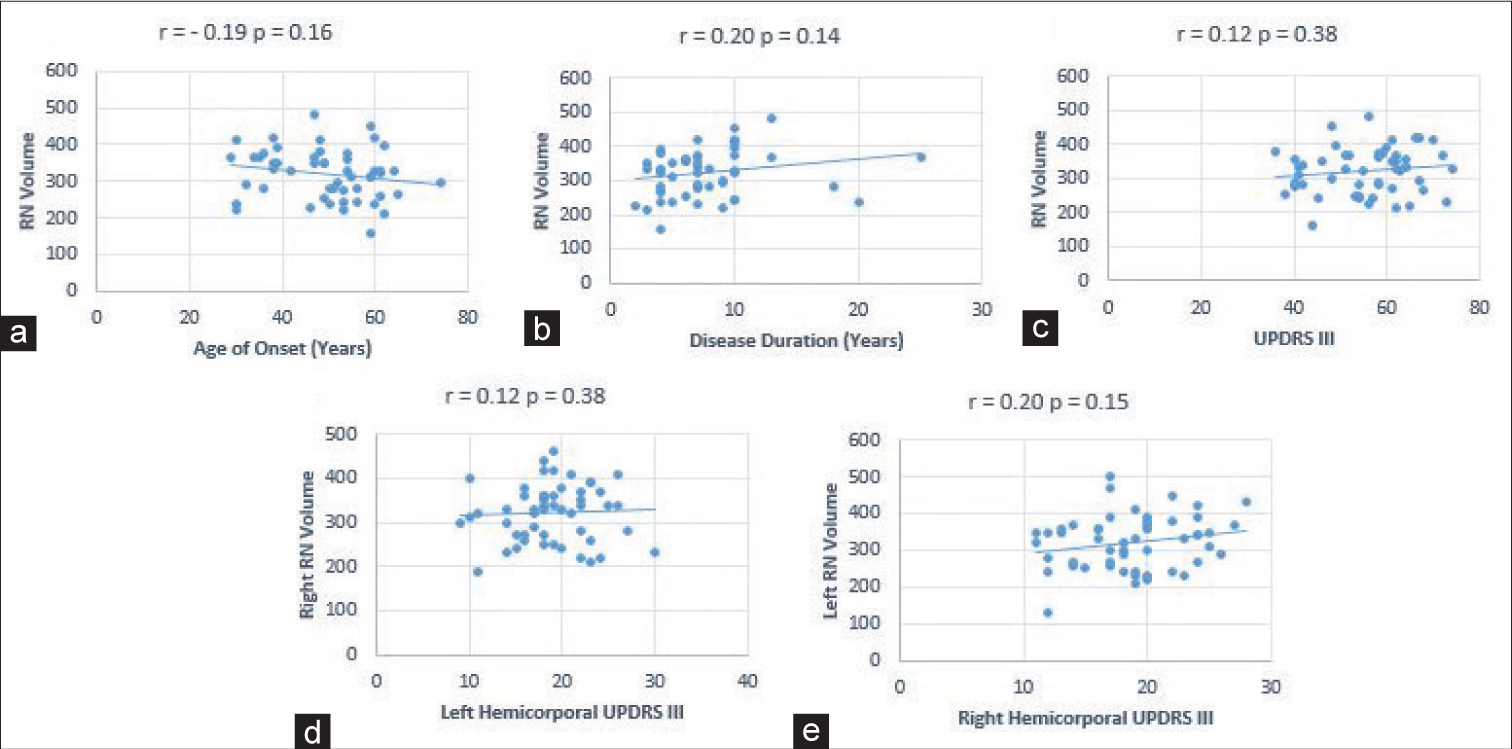
Figure 5:
Scatter plot showing correlation between RN volume and (a) age of onset, (b) disease duration, (c) UPDRS III and (d) right RN volume and left hemicorporal UPDRS III, 5e) left RN volume and right hemicorporal UPDRS III. RN: Red nucleus, UPDRS III: Unified Parkinson’s disease rating scale part III.

DISCUSSION
PD, a progressive neurologic disorder which is known to affect more than 1% of the population over 65 years of age, is characterized by the varying intensity of tremor, rigidity, and bradykinesia.[
Targeting the STN in DBS can also be done based on AC-PC relations and relation with RN. On comparison of MR and atlas based targeting methods Ashkan et al.[
Volumetric analysis of STN plays an important role in planning of target in DBS. Motor and cognition disturbances can occur after DBS. These changes can be attributed to suboptimal placement of electrodes or to spread of current to surrounding structures.[

We did not notice any statistical correlation between STN volumes and disease duration. In neuropathological case– control studies, similar observations were noted, leading to an inference that the volume of STN does not change with disease duration and severity.[
We noticed a positive trend between disease duration and volume of RN. Patient with early onset PD had more volumes than late onset PD which are consistent with findings from previous studies.[
CONCLUSION
Longer disease duration and early age of onset in PD can be associated with increased RN volume. Volume of STN stays consistent as the disease progresses.
Declaration of patient consent
Patient’s consent not required as patients identity is not disclosed or compromised.
Financial support and sponsorship
Publication of this article was made possible by the James I. and Carolyn R. Ausman Educational Foundation.
Conflicts of interest
There are no conflicts of interest.
References
1. Abosch A, Yacoub E, Ugurbil K, Harel N. An assessment of current brain targets for deep brain stimulation surgery with susceptibility-weighted imaging at 7 tesla. Neurosurgery. 2010. 67: 1745-56
2. Ashkan K, Blomstedt P, Zrinzo L, Tisch S, Yousry T, Limousin-Dowsey P. Variability of the subthalamic nucleus: The case for direct MRI guided targeting. Br J Neurosurg. 2007. 21: 197-200
3. Benazzouz A, Piallat B, Ni ZG, Koudsie A, Pollak P, Benabid AL. Implication of the subthalamic nucleus in the pathophysiology and pathogenesis of Parkinson’s disease. Cell Transplant. 2000. 9: 215-21
4. Bergman H, Wichmann T, Karmon B, DeLong MR. The primate subthalamic nucleus. II. Neuronal activity in the MPTP model of parkinsonism. J Neurophysiol. 1994. 72: 507-20
5. Camlidag I, Kocabicak E, Sahin B, Jahanshahi A, Incesu L, Aygun D. Volumetric analysis of the subthalamic and red nuclei based on magnetic resonance imaging in patients with Parkinson’s disease. Int J Neurosci. 2014. 124: 291-5
6. Cheng CH, Huang HM, Lin HL, Chiou SM. 1.5T versus 3T MRI for targeting subthalamic nucleus for deep brain stimulation. Br J Neurosurg. 2014. 28: 467-70
7. Colpan ME, Slavin KV. Subthalamic and red nucleus volumes in patients with Parkinson’s disease: Do they change with disease progression?. Parkinsonism Relat Disord. 2010. 16: 398-403
8. Driver JA, Logroscino G, Gaziano JM, Kurth T. Incidence and remaining lifetime risk of Parkinson disease in advanced age. Neurology. 2009. 72: 432-8
9. den Dunnen WF, Staal MJ. Anatomical alterations of the subthalamic nucleus in relation to age: A postmortem study. Mov Disord. 2005. 20: 893-8
10. Gasparotti R, Pinelli L, Liserre R. New MR sequences in daily practice: Susceptibility weighted imaging. A pictorial essay. Insights Imaging. 2011. 2: 335-47
11. Habas C, Cabanis EA. Cortical projections to the human red nucleus: A diffusion tensor tractography study with a 1.5-T MRI machine. Neuroradiology. 2006. 48: 755-62
12. Hardman CD, Halliday GM, McRitchie DA, Morris JG. The subthalamic nucleus in Parkinson’s disease and progressive supranuclear palsy. J Neuropathol Exp Neurol. 1997. 56: 132-42
13. Krack P, Pollak P, Limousin P, Hoffmann D, Xie J, Benazzouz A. Subthalamic nucleus or internal pallidal stimulation in young onset Parkinson’s disease. Brain. 1998. 121: 451-7
14. Lévesque JC, Parent A. GABAergic interneurons in human subthalamic nucleus. Mov Disord. 2005. 20: 574-84
15. Lewis MM, Du G, Kidacki M, Patel N, Shaffer ML, Mailman RB. Higher iron in the red nucleus marks Parkinson’s dyskinesia. Neurobiol Aging. 2013. 34: 1497-503
16. Lucerna SSalpietro FMAlafaci CTomasello F. In Vivo Atlas of Deep Brain Structures: With 3D Reconstructions. Available from: https://www.springer.com/gp/book/9783540425618 [Last accessed on 2020 Dec 25].
17. Massey LA, Miranda MA, Zrinzo L, Al-Helli O, Parkes HG, Thornton JS. High resolution MR anatomy of the subthalamic nucleus: Imaging at 9.4 T with histological validation. Neuroimage. 2012. 59: 2035-44
18. McIntyre CC, Mori S, Sherman DL, Thakor NV, Vitek JL. Electric field and stimulating influence generated by deep brain stimulation of the subthalamic nucleus. Clin Neurophysiol. 2004. 115: 589-95
19. Moro E, Scerrati M, Romito LM, Roselli R, Tonali P, Albanese A. Chronic subthalamic nucleus stimulation reduces medication requirements in Parkinson’s disease. Neurology. 1999. 53: 85-90
20. O’Gorman RL, Shmueli K, Ashkan K, Samuel M, Lythgoe DJ, Shahidiani A. Optimal MRI methods for direct stereotactic targeting of the subthalamic nucleus and globus pallidus. Eur Radiol. 2011. 21: 130-6
21. Plaha P, Ben-Shlomo Y, Patel NK, Gill SS. Stimulation of the caudal zona incerta is superior to stimulation of the subthalamic nucleus in improving contralateral parkinsonism. Brain. 2006. 129: 1732-47
22. Pringsheim T, Jette N, Frolkis A, Steeves TDL. The prevalence of Parkinson’s disease: A systematic review and meta-analysis. Mov Disord. 2014. 29: 1583-90
23. Rauscher A, Sedlacik J, Barth M, Haacke EM, Reichenbach JR. Nonnvasive assessment of vascular architecture and function during modulated blood oxygenation using susceptibility weighted magnetic resonance imaging. Magn Reson Med. 2005. 54: 87-95
24. Remple MS, Bradenham CH, Kao CC, Charles PD, Neimat JS, Konrad PE. Subthalamic nucleus neuronal firing rate increases with Parkinson’s disease progression. Mov Disord. 2011. 26: 1657-62
25. Schaltenbrand G. Atlas for Stereotaxy of the Human Brain. Available from: https://www.ci.nii.ac.jp/naid/10029743082 [Last accessed on 2020 Dec 25].
26. Shah V, Alugolu R, Arora A, Kandadai RM, Mudumba V, Borgohain R. 3T MRI-SWI based volumetric analysis of the subthalamic and red nuclei in advanced Parkinson’s disease. J Neurosurg Sci. 2020. p.
27. Shen W, Wang H, Lin Z, Shen H, Chen X, Fu Y. Stereotactic localization and visualization of the subthalamic nucleus. Chin Med J (Engl). 2009. 122: 2438-43
28. Vertinsky AT, Coenen VA, Lang DJ, Kolind S, Honey CR, Li D. Localization of the subthalamic nucleus: Optimization with susceptibility-weighted phase MR imaging. Am J Neuroradiol. 2009. 30: 1717-24
29. Welter ML, Schüpbach M, Czernecki V, Karachi C, Fernandez-Vidal S, Golmard JL. Optimal target localization for subthalamic stimulation in patients with Parkinson disease. Neurology. 2014. 82: 1352-61
30. Zonenshayn M, Rezai AR, Mogilner AY, Beric A, Sterio D, Kelly PJ. Comparison of anatomic and neurophysiological methods for subthalamic nucleus targeting. Neurosurgery. 2000. 47: 282-92