- Department of Neurosurgery, King Edward Medical University Pakistan, Lahore, Pakistan
- Department of Neurosurgery, Jinnah Sindh Medical University, Karachi, Sindh, Pakistan
- Department of Medicine, Jinnah Sindh Medical University, Karachi, Sindh, Pakistan
- Department of Medicine, Dow University of Health Sciences, Karachi, Sindh, Pakistan
- Department of Neurosurgery, American University of Antigua, Coolidge, Saint George Parish, Antigua and Barbuda
- Department of Medicine, Liaquat College of Medicine and Dentistry, Karachi, Pakistan
- Department of Medicine, Shaheed Mohtarma Benazir Bhutto Medical College, Karachi, Pakistan
- Department of Neurosurgery, University of Chicago, Chicago, United States
- Wolfson School of Medicine, University of Glasgow, Scotland, United Kingdom
Correspondence Address:
Mohammad Ashraf, Wolfson School of Medicine, University of Glasgow, Scotland, United Kingdom.
DOI:10.25259/SNI_592_2024
Copyright: © 2024 Surgical Neurology International This is an open-access article distributed under the terms of the Creative Commons Attribution-Non Commercial-Share Alike 4.0 License, which allows others to remix, transform, and build upon the work non-commercially, as long as the author is credited and the new creations are licensed under the identical terms.How to cite this article: Javed Iqbal1, Muhammad Ashir Shafique2, Burhanuddin Sohail Rangwala3, Hafsah Alim Ur Rahman4, Muhammad Abdullah Naveed4, Afia Fatima3, Ahila Ali4, Tirath Patel5, Moosa Abdur Raqib6, Muhammad Saqlain Mustafa3, Abdul Haseeb3, Sandesh Raja4, Adarsh Raja7, Stephanie Hage8, Mohammad Ashraf9. Demographic and regional patterns of epilepsy-related mortality in the USA: Insights from CDC WONDER data. 06-Dec-2024;15:450
How to cite this URL: Javed Iqbal1, Muhammad Ashir Shafique2, Burhanuddin Sohail Rangwala3, Hafsah Alim Ur Rahman4, Muhammad Abdullah Naveed4, Afia Fatima3, Ahila Ali4, Tirath Patel5, Moosa Abdur Raqib6, Muhammad Saqlain Mustafa3, Abdul Haseeb3, Sandesh Raja4, Adarsh Raja7, Stephanie Hage8, Mohammad Ashraf9. Demographic and regional patterns of epilepsy-related mortality in the USA: Insights from CDC WONDER data. 06-Dec-2024;15:450. Available from: https://surgicalneurologyint.com/?post_type=surgicalint_articles&p=13271
Abstract
Background: Epilepsy poses significant challenges globally, with varied clinical, social, and economic impacts. Despite advances in treatment, epilepsy-related mortality remains a concern. This study aimed to analyze the demographic and regional distributions of epilepsy-related mortality in the United States (U.S.) from 1999 to 2020, identifying high-risk populations for targeted interventions.
Methods: Data on death certificates were obtained from the 1999 to 2020 Centers for Disease Control and Prevention Wide-Ranging Online Study Epidemiologic Research (CDC-WONDER) database. We gathered data on demographics, place of death, and urban/rural classification. Mortality rates per 100,000 people were computed and classified according to state, year, sex, race/ethnicity, and urban/rural status. Trends were examined using Joinpoint regression.
Results: A total of 12,573 deaths (age less than 35), 22,947 (35–64), and 21,782 (65+) were attributed to epilepsy. Mortality rates varied by age group, sex, race/ethnicity, and region. Trends showed significant increases, notably in middle-aged and older adults, with higher rates in males and nonHispani, African American populations.
Conclusion: Epilepsy-related mortality exhibits demographic and regional disparities in the U.S. Understanding these patterns can guide targeted interventions to mitigate mortality risk.
Keywords: Demographics, Epilepsy, Mortality, Regional distribution, United States
INTRODUCTION
Significant neurological conditions like epilepsy can be prevented, and their symptoms can be controlled. It also has extensive clinical, psychological, and economic ramifications that vary globally and are linked to varying incidence, prevalence, and mortality rates.[
Between 1% and 2% of people worldwide have epilepsy, a neurological condition that affects about 3.4 million people in the United States (U.S.).[
Five novel anti-seizure drugs (brivaracetam, cannabidiol, cenobamate, everolimus, and fenfluramine) have been used as recent therapies for epilepsy.[
Although there has been significant advancement in the treatment of epilepsy, the death rate related to this illness has not yet been fully studied. This is due to the fact that no previous study has focused on or published death rates among epileptic patients. The objective of the current study was to examine the geographic and demographic patterns of mortality associated with epilepsy in the U.S. between 1999 and 2020. To enable prompt actions to lower death rates, this investigation sought to identify the groups most at risk of epilepsy-related mortality. The study extracts data from death certificates from the Centers for Disease Control and Prevention Wide-Ranging Online Study Epidemiologic Research (CDC WONDER) using the International Classification of Diseases, Tenth Revision (ICD-10) codes.
METHODOLOGY
Study setting and population
Data from death certificates for the years 1999–2020 were obtained from the CDC WONDER database using the ICD-10 codes. Particular codes used were G40.0, G40.1, G40.2, G40.3, G40.4, G40.5, G40.6, G40.7, G40.8, and G40.9. The multiple cause-of-death public-use record death certificates were used to identify deaths connected to epilepsy, that is, deaths in which epilepsy was mentioned as an underlying or contributing cause of death on the death certificate. This included data extracted from death certificates in the District of Columbia and all 50 states. All patients with epilepsy as the cause of death, regardless of age at death, were included in this study. This study has been exempted from local institutional review board clearance since it used a de-identified public use data set from the government and followed Strengthening the Reporting of Observational Studies in Epidemiology reporting guidelines.
Data extraction
Demographics, place of death, year of death, urban/rural classification, regional split, and state-specific data were gathered. The demographic section contained information on race/ethnicity, age, and sex. The places of death included homes, hospices, nursing homes/long-term care facilities, and medical facilities (death on arrival, outpatient, inpatient, emergency room, or status unknown). Based on information from death certificates and earlier WONDER database study, race/ethnicity was divided into nonHispanic (NH) or African American; NH White, NH Asian, or Pacific Islander; Hispanic or Latino; and NH American Indian or Alaskan Native categories. The National Center for Health Statistics Urban-Rural Classification Scheme categorizes the population into urban and rural areas based on the 2013 U.S. census. Urban areas were further subdivided into medium/ small metropolitan regions, which have populations between 50,000 and 999,999, and big metropolitan areas, which have populations over one million. In the current investigation, the same classification scheme was applied. Geographical regions were categorized using the U.S. Census Bureau’s guidelines into the Midwest, Northeast, South, and West areas.
Statistical analysis
We looked into epilepsy-related mortality trends by carefully analyzing data from 1999 to 2020. With a focus on regional patterns, mortality rates per 100,000 people were computed for both age-adjusted and unadjusted data. These rates came with 95% confidence intervals (CIs) and were broken down by year, sex, race/ethnicity, state, and urban/rural status. The total number of deaths from epilepsy divided by the matching U.S. population for each year yielded the crude mortality rates. Up to 2000, the U.S. epilepsy-related deaths were standardized to determine age-adjusted mortality rates (AAMR). We used the Joinpoint Regression Program (Version 5.0.2, National Cancer Institute) to analyze the annual percent change (APC) and its related 95% CI in age-adjusted mortality rates (AAMR) to identify any significant changes over time.
RESULTS
Between 1999 and 2020, there were 12,573 deaths in the population under 35 years old that were associated with epilepsy [
For 12550 cases, information on the place of death for infants to younger adults (those under 35) was available. Of them, 47.9% happened at home, 2% happened in nursing homes or long-term care facilities, 1.4% happened in hospices, and 41.1% happened in medical facilities [
A total of 269283 fatalities among middle-aged people (aged 35–64) were recorded. Of them, 34.7% happened at home, 9.2% in long-term care or nursing homes, 2.4% in hospices, and 50.3% occurred in medical facilities [
Annual trends in AAMR associated with epilepsy in infants to young adults
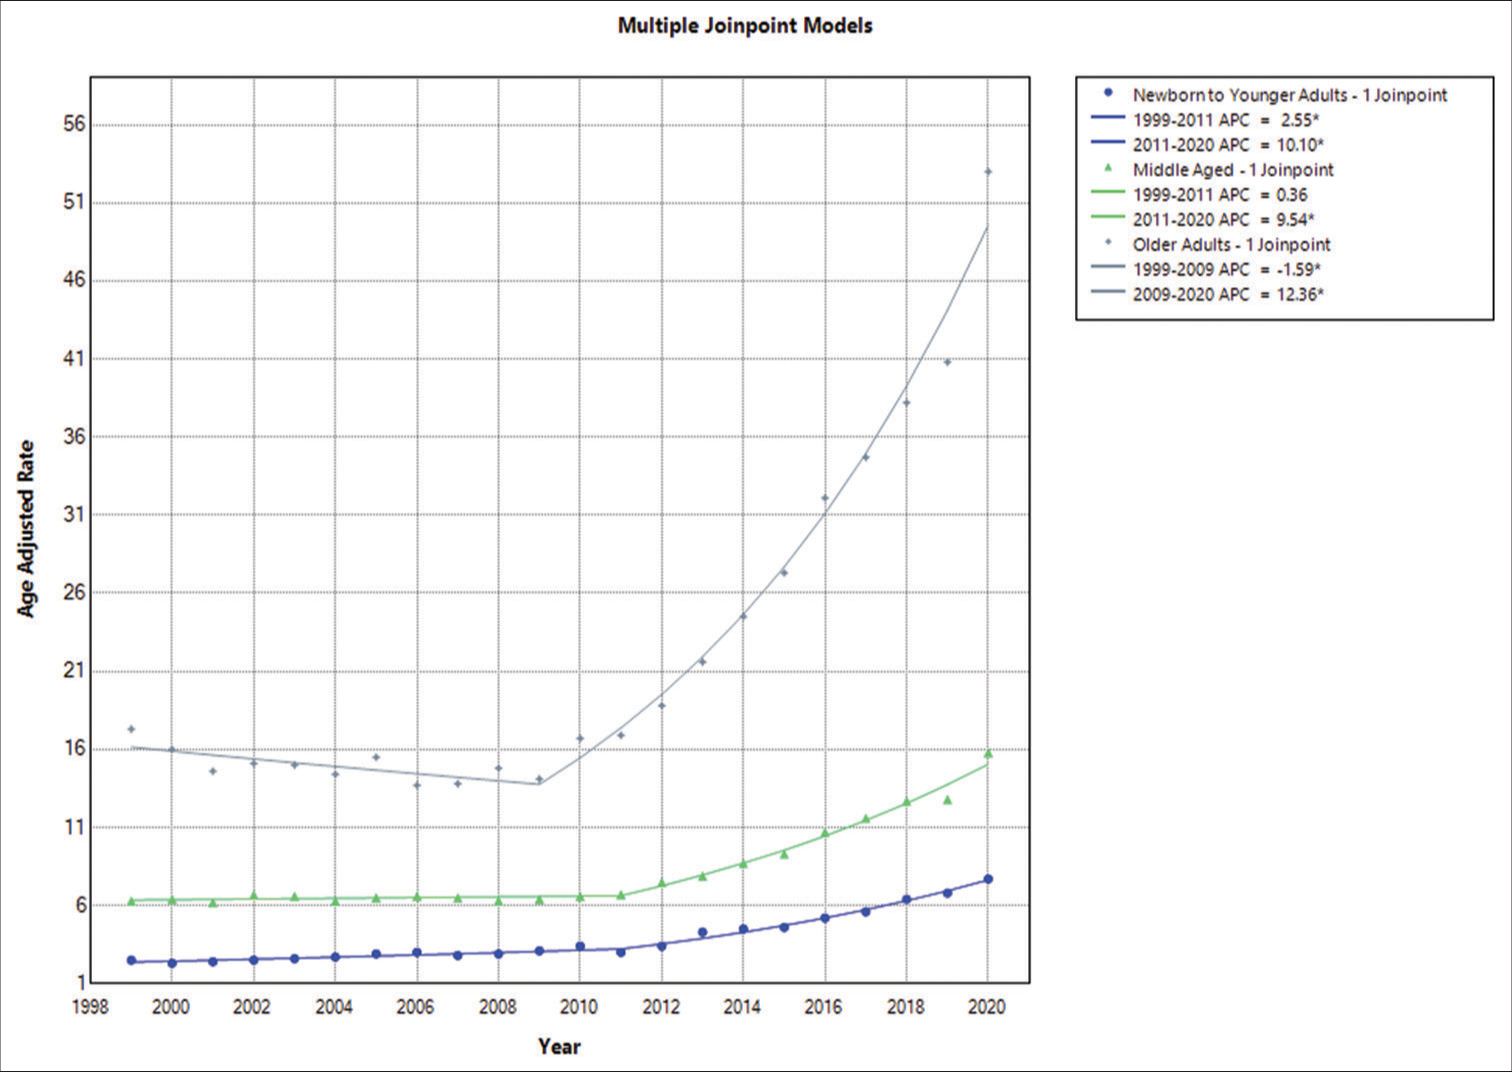
In 1999, the AAMR for fatalities in the population of <35 years caused by epilepsy was 1.9 (95% CI: 1.6–2.2); by 2020, it had increased to 6.3 (95% CI: 5.7–6.9). The AAMR increased overall between 1999 and 2011, with a noteworthy APC of 3.7016 (95% CI: 1.0337–5.3265). From 2011 to 2020, there was another notable increase, with an APC of 9.1412 (95% CI: 7.6822–11.7359) [
Epilepsy-related yearly patterns in AAMR in middle-aged adults
In 1999, the AAMR for epilepsy-related deaths in people aged 35–64 was 6.3 (95% CI: 5.8–6.8); by 2020, it had risen to 15.8 (95% CI: 15.1–16.5). AAMR increased significantly between 1999 and 2011 (APC of 0.3596, 95% CI: −0.4050–0.9969) and then increased significantly again between 2011 and 2020 (APC of 9.5371, 95% CI: 8.6977–10.8628) [
Epilepsy-related yearly patterns in AAMR in older adults
In addition, in 1999, the AAMR for fatalities in the population of 64 and above years of age caused by epilepsy was 17.3 (95% CI: 15.9–18.6); by 2020, it had increased to 53 (95% CI: 51.1–55). With an APC of −1.5866 (−3.3958–−0.0128), the AAMR showed a large overall decline from 1999 to 2009. From 2009 to 2020, however, there was a significant increase, with an APC of 12.3579 (11.4440–13.5803) [
Epilepsy gender-based annual trends in AAMR among infants and young adults
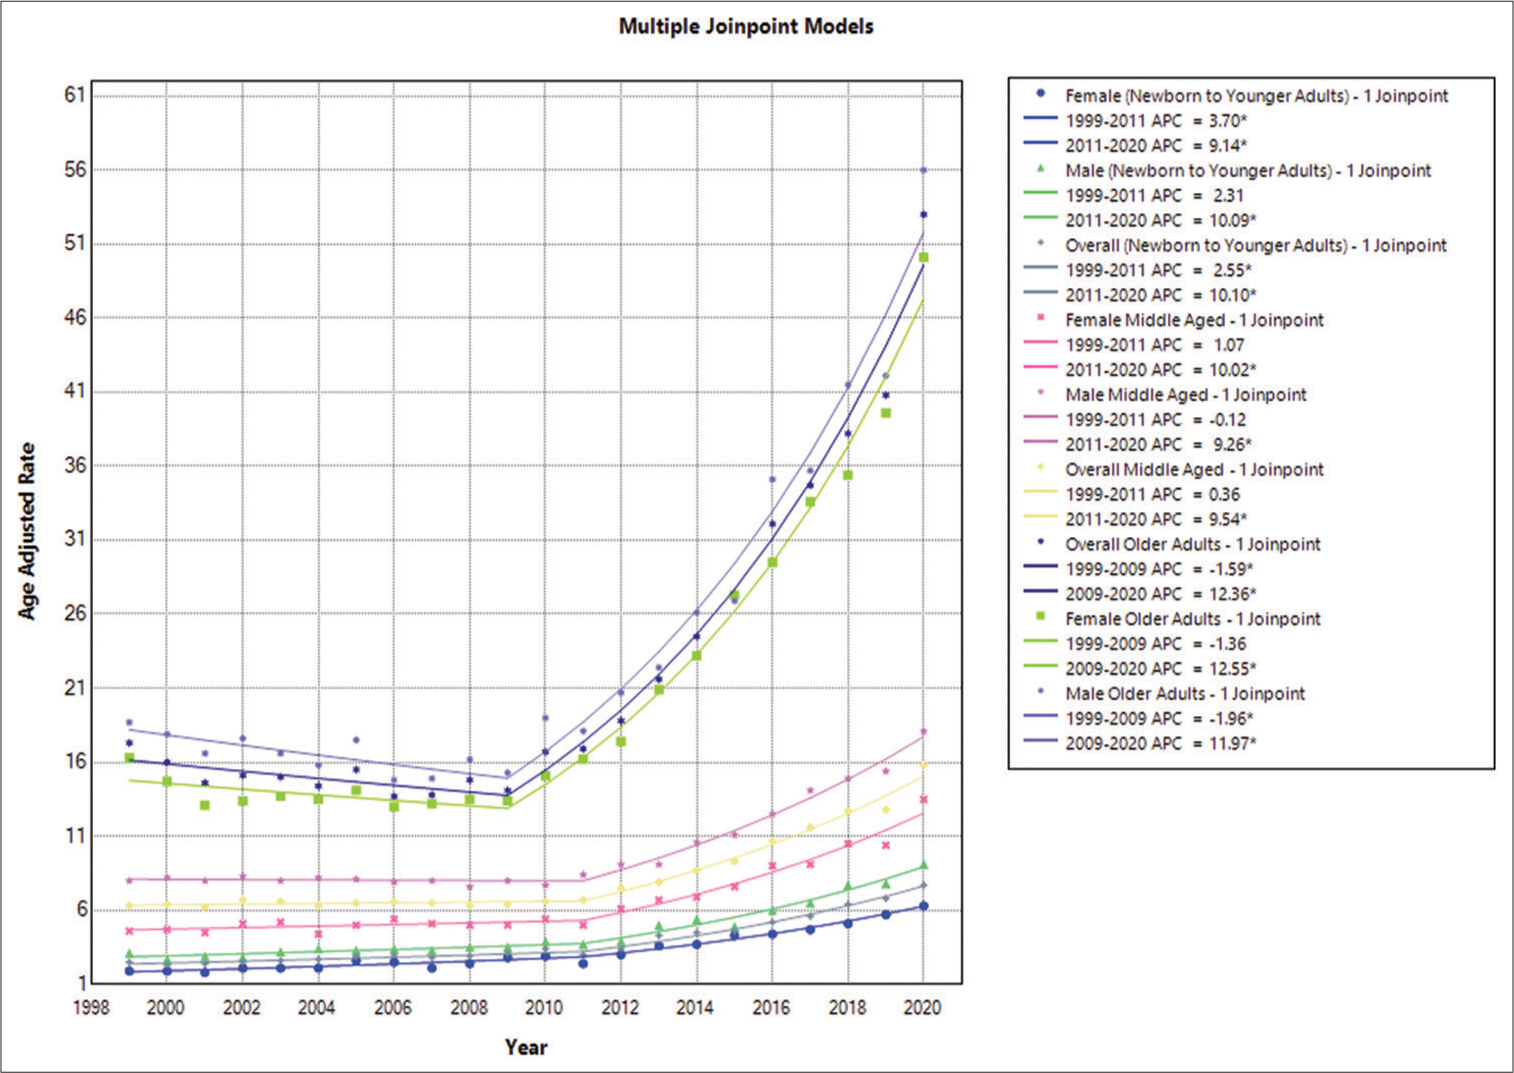
The study found that across all age categories, male AAMRs were consistently higher than female AAMRs, with men’s having overall AAMRs of 4.6 (95% CI: 4.4–4.7) and women’s having overall AAMRs of 3.2 (95% CI: 3.1–3.3). Male AAMR in 1999 was 3.1, with a 95% CI of 2.7–3.5. The APC increased to 3.7 (95% CI: 3.2–4.1) in 2011, indicating an increase in the rate. A following increase in AAMR to 9.1 (95% CI: 8.4–9.7) with an APC of 10.0922 and a 95% CI spanning from 8.4824 to 13.8721 occurred in 2020. In 1999, women’s AAMR was 1.9, with a 95% CI spanning from 1.6 to 2.2. APC of 2.5547 (95% CI: 1.5827–3.3951) indicates that the AAMR went risen between 1999 and 2011. With an APC of 10.1021 (95% CI: 9.0051–11.8872), there was a further, more notable increase through 2020. By the end of the study period, the female AAMR was 6.3 (95% CI: 5.7–6.9) [
Epilepsy gender-based annual trends in AAMR among middle-aged adults
Males’ AAMRs were higher than females’ across the board for all ages in the analysis conducted for people aged 35–64. Men’s overall AAMRs were 10.2 (95% CI: 10–10.3), while women’s were 6.7 (95% CI: 6.6–6.8). Male AAMR in 1999 was 8, with a 95% CI of 7.2–8.8. The AAMR value changed to 8.4 (95% CI: 7.7–9.2) in 2011, with the APC showing a slight decreasing trend of −0.1168 (95% CI: −0.8942–0.5252). There was a significant increase to 18.1 (95% CI: 17.1–19.2) in 2020 in AAMR with an APC of 9.2574 (95% CI: 8.5433–10.2134). Comparable to this, the 1999 AAMR for women between the ages of 35 and 64 was 4.6 (95% CI: 4.1–5.2). APC of 1.0686 (95% CI: −0.9412–2.5645) indicates that the AAMR went up between 1999 and 2011. Up to 2020, there was a more notable increase, with an APC of 10.0227 (95% CI: 8.4063–12.4949). By the end of the study period, the AAMR for females was 13.5 (95% CI: 12.6–14.4) [
Epilepsy-related yearly patterns in AAMR graded by gender in older adults
The overall AAMRs of men and women were found to be consistently higher in the study on mortality trends for ages spanning from 65 and above. Men’s AAMRs were 25.6 (95% CI: 25.1–26.1), and women’s AAMRs were 22 (95% CI: 21.7–22.4). In 1999, male AAMR was 18.7, with a 95% CI of 16.3–21. The AAMR value changed to 15.3 (95% CI: 13.4–17.2) in 2009. The APC values also showed a slightly decreasing trend of −1.9575 (95% CI: −4.2313–−0.0398). There was a significant increase to 56 (95% CI: 53–59.1) in 2020 with an APC of 11.9738 (95% CI: 10.8531–13.5006). Similar to this, the AAMR for women aged 65 and above in 1999 was 16.3 (95% CI: 14.6– 18) with an APC of −1.3562 (95% CI: −3.1845–0.1553). The years 1999–2009 saw a decrease in the AAMR. Up to 2020, there was a more notable increase, with an APC of 12.5546 (95% CI: 11.6798–13.7399). By the end of the study period, the AAMR for females was 50.1 (95% CI: 47.6–52.7) [
Epilepsy and race-based annual trends in AAMR among newborn and young adults
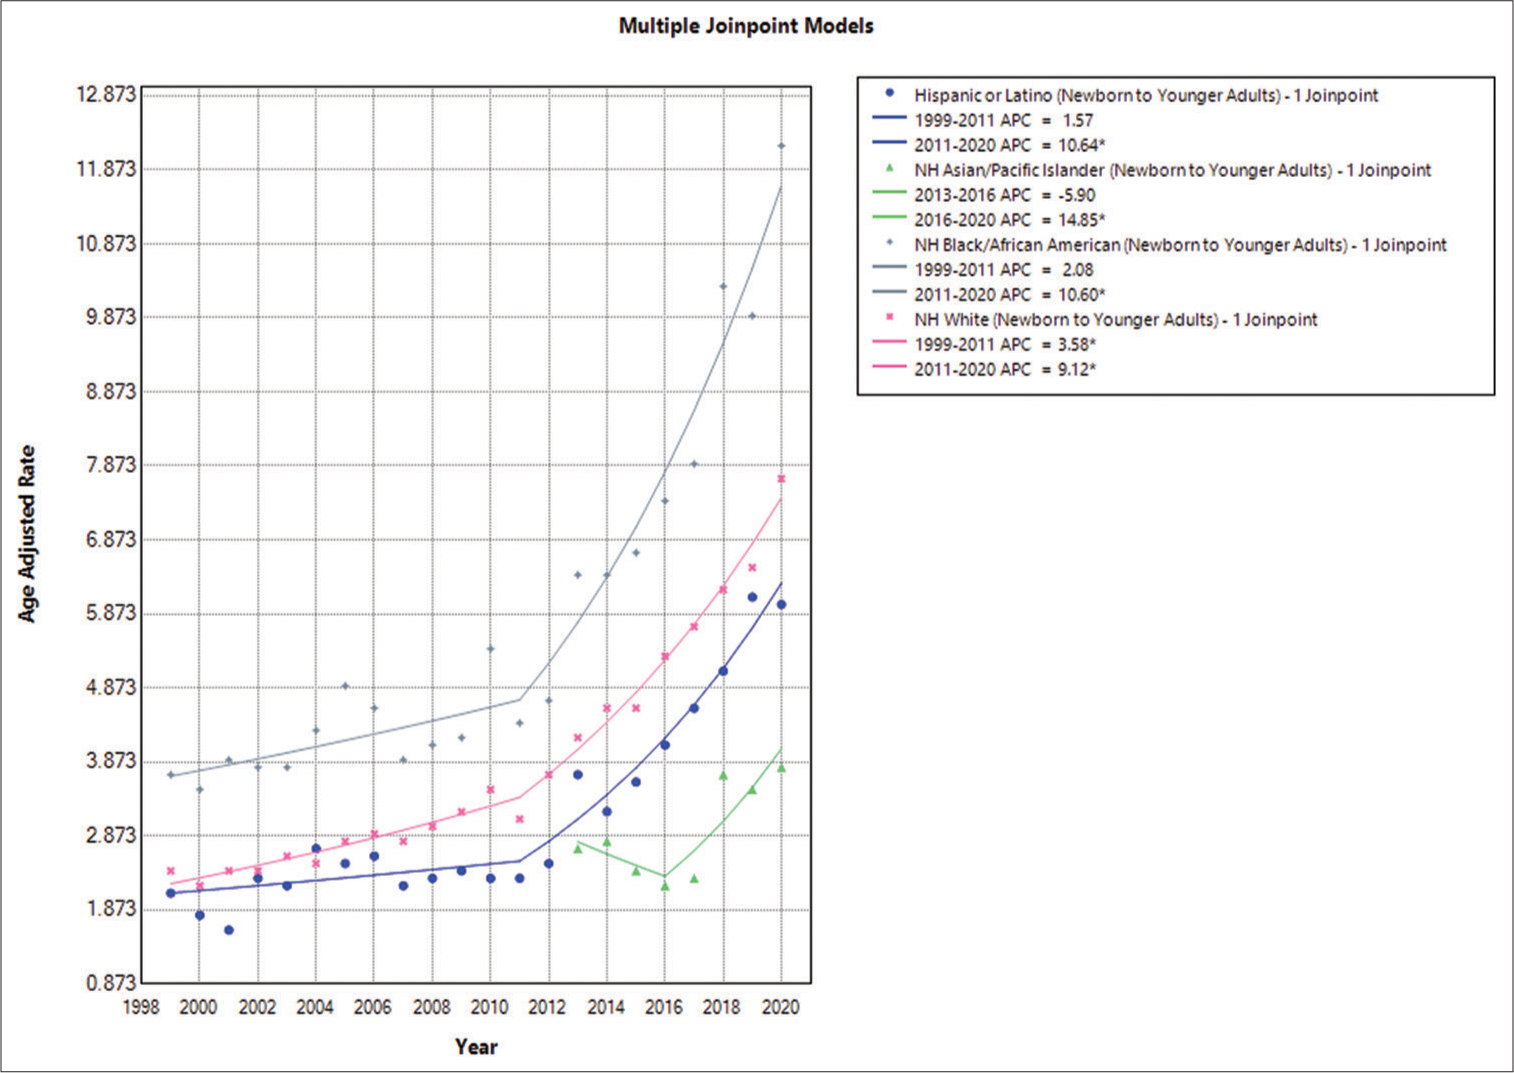
In this population, the NH or African American population had the highest AAMRs, followed by the NH American Indian or Alaska Native, NH White, and Hispanic or Latino groups. The following were the overall AAMR values: NH or African American, 5.8 (95% CI: 5.6–6); NH American Indian or Alaska Native, 4.2 (95% CI: 3.4–4.9); NH White, 3.8 (95% CI: 3.7–3.9); and Hispanic or Latino, 3.2 (95% CI: 3.1–3.4). In conclusion, there was an increase in AAMR among NH White people between 1999 and 2011. The APC was 2.0765 (95% CI: −2.2581–4.2343). A significant increase in the mortality trend was observed with an APC of 10.6017 (95% CI: 8.2341–16.3243) through 2020. The AAMR for the NH or African American population increased similarly from 1999 to 2011, with an APC of 2.0765 (95% CI: −2.2581–4.2343), which showed a significant increase until 2020 with an APC of 10.6017 (95% CI: 8.2341–16.3243). From 1999 to 2011, the AAMR for the Hispanic or Latino population increased, and the APC was 1.5668 (95% CI: −2.5224–4.1074). Subsequently, there was an increase in mortality until 2020, with an APC of 10.6381 (95% CI: 8.3859–16.3447) [
Epilepsy-related yearly patterns in AAMR graded by race/ethnicity in middle-aged adults
The highest AAMR was observed in the NH or African American population, followed by the NH American Indian or Alaska Native, NH White, Hispanic or Latino, and NH Asian or Pacific Islander groups. The corresponding AAMR values for each group were as follows: NH White: 8 (95% CI: 7.9–8.2), NH American Indian or Alaska Native: 13.4 (95% CI: 11.8–14.9), NH Asian or Pacific Islander: 2.5 (95% CI: 2.3–2.8), Hispanic or Latino: 3.2 (95% CI: 3.1–3.4), and NH or African American: 14.5 (95% CI: 14.1–14.9). Between 1999 and 2011, the AAMR for NH White individuals increased, with an APC of 1.2072 (95% CI: 0.0996– 2.1401). Furthermore, a rising mortality trend was observed, with an APC of 9.8766 (95% CI: 8.9024–11.1332) until 2020. In contrast, the AAMR for the Hispanic and Latino populations decreased from 1999 to 2011, with an APC of −0.6206 (95% CI: −13.9388– 2.9201), and then increased significantly until 2020, with an APC of 8.8012 (95% CI: 5.3485–22.3329). The AAMR for NH and African American individuals also decreased from 1999 to 2010, with an APC of −2.5489 (95% CI: −5.0380–−0.6865). After that, mortality rates increased until 2020, with an APC of 9.2360 (95% CI: 7.4995–11.8797) [
Epilepsy-related yearly patterns in AAMR graded by race/ethnicity in older adults
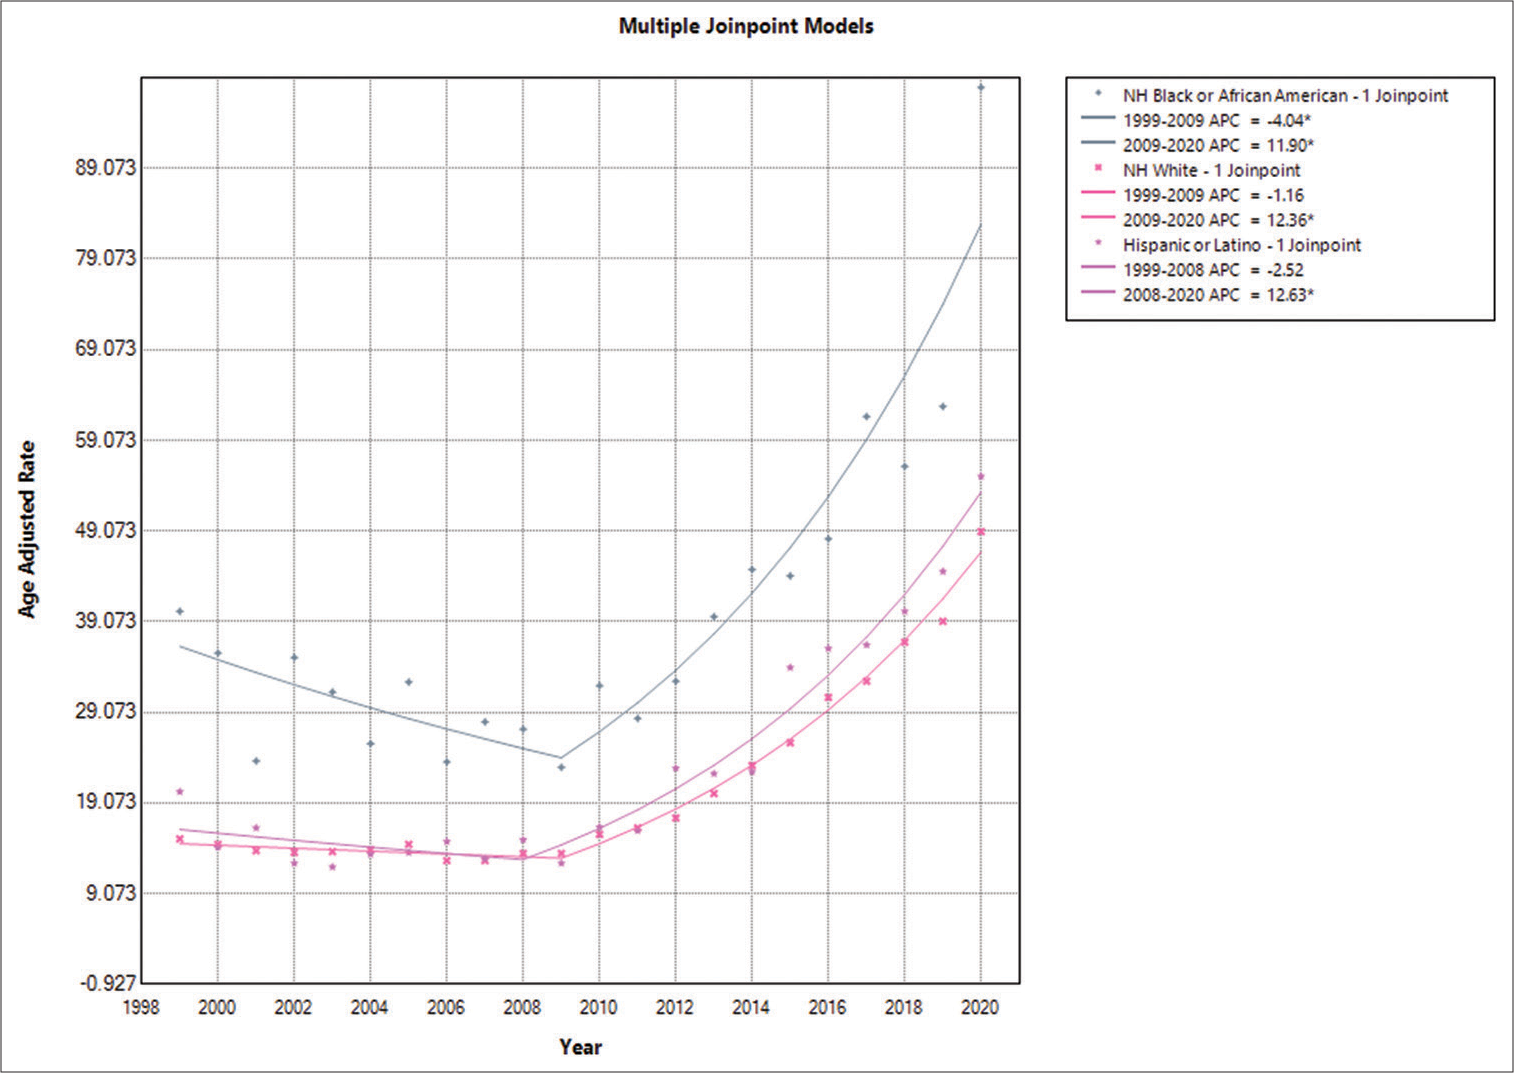
The highest AAMR was observed in the NH and African American groups, followed by the Hispanic, Latino, and NH White groups. The respective AAMR values were as follows: NH or African American: 42.5 (95% CI: 41.1–44.0), NH White: 21.8 (95% CI: 21.5–22.1), and Hispanic or Latino: 26.7 (95% CI: 25.3–28.0). It was concluded that there was a decrease in AAMR for NH or African American individuals between 1999 and 2009, with an APC of −4.0413 (95% CI: −9.3105–−0.3574). In addition, a rising mortality trend was observed, with an APC of 11.9042 (95% CI: 9.6239–15.6015) through 2020. The AAMR for NH White individuals showed an increasing trend from 1999 to 2009, with an APC of −1.1620 (95% CI: −2.7863–0.1569). This trend continued to increase from 2009 to 2020, with an APC of 12.3621 (95% CI: 11.5653–13.5243). The AAMR for the Hispanic and Latino populations also decreased from 1999 to 2008, with an APC of −2.5244 (95% CI: −19.1973– 3.9210), which then showed a significant increase until 2020, with an APC of 12.6252 (95% CI: 10.4388–17.4924) [
Epilepsy-related yearly patterns in AAMRs graded by geographic region
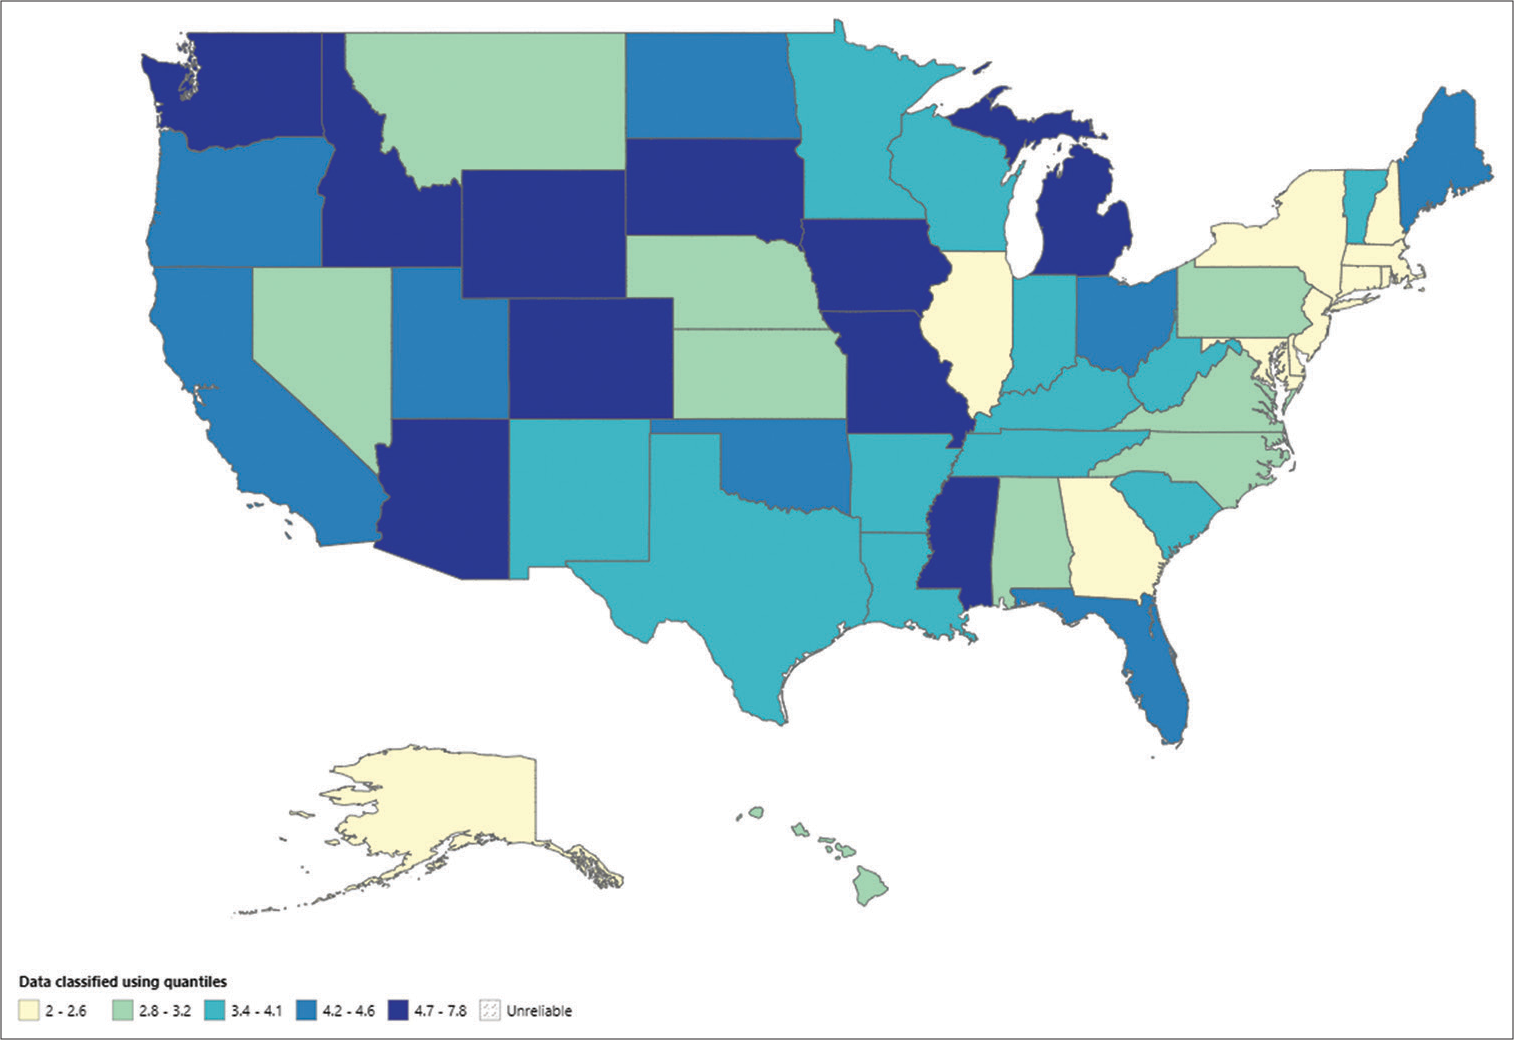
States - Newborn to younger adults
There were notable differences in the AAMR among the states, ranging from 2 (95% CI: 1.6–2.3) in Massachusetts to 7.8 (95% CI: 7.2–8.3) in Michigan. AAMRs were more than 3 times higher in the top 90th percentile (South Dakota, Massachusetts) than in the bottom 10th percentile (New Hampshire, Massachusetts, Maryland, Delaware, Connecticut, and New York breeds) [
The AAMR, which varied from 2 (95% CI: 1.6–2.3) in Massachusetts to 7.8 (95% CI: 7.2–8.3) in Michigan, was significantly different in each state. The AAMRs of the breeds in the lowest 10th percentile (New Hampshire, Massachusetts, Maryland, Delaware, Connecticut, and New York) were <3 times greater than those of the top 90th percentile (South Dakota and Massachusetts) [
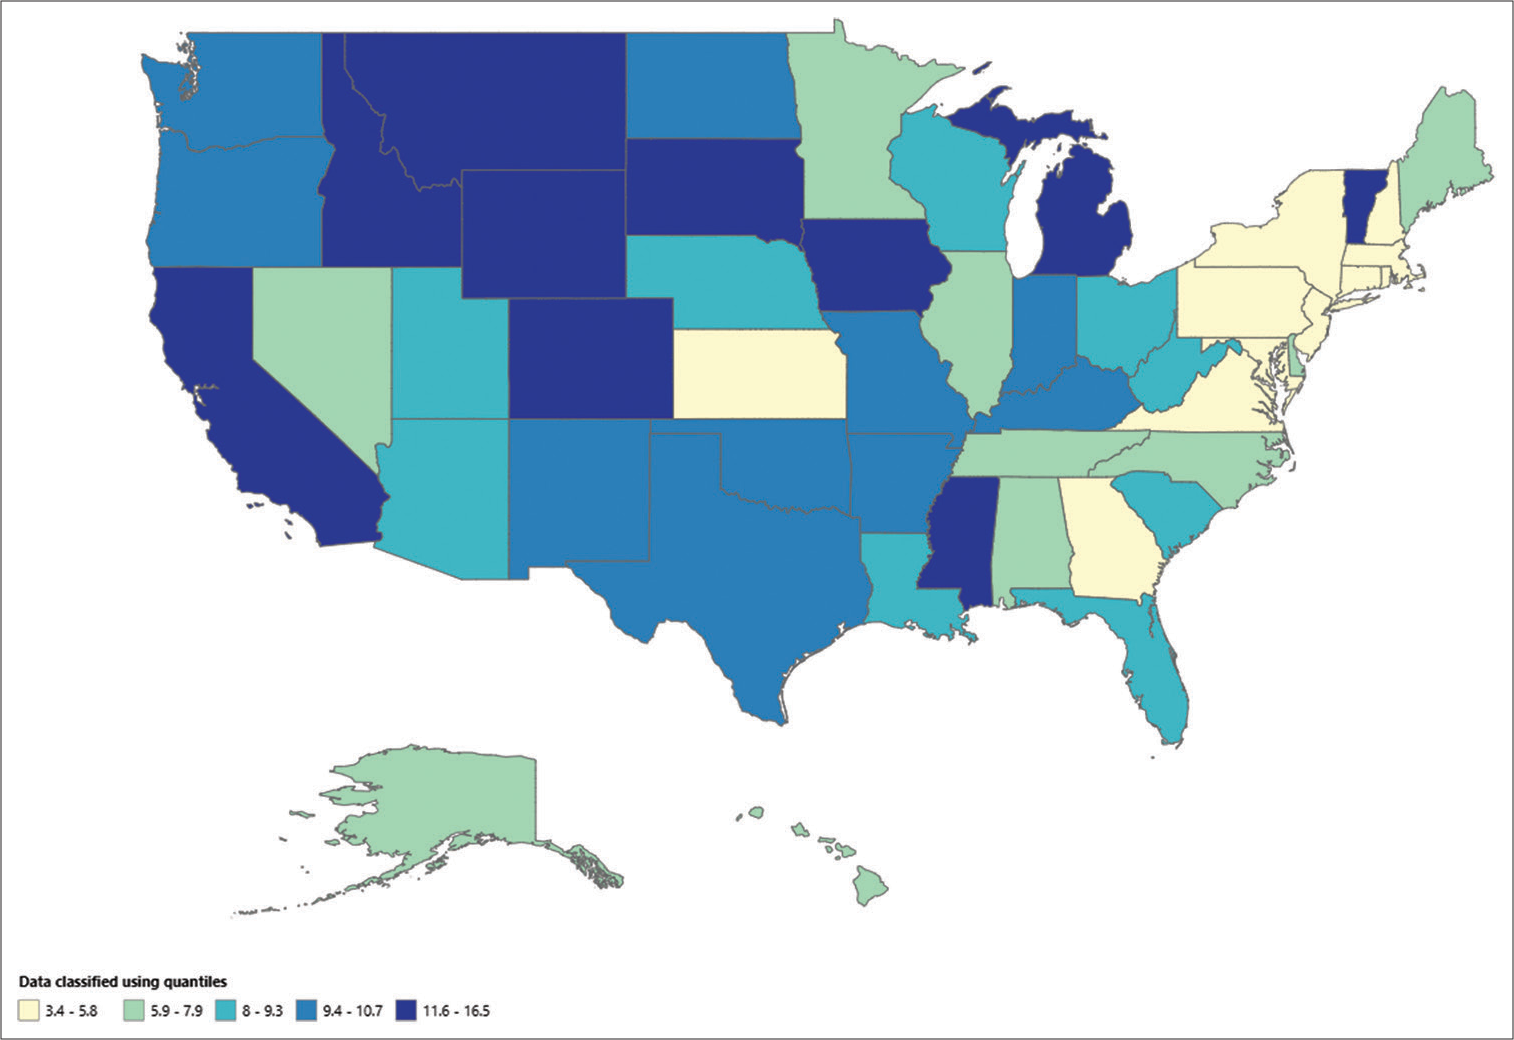
States – Middle-aged adults
The AAMR, which spanned from 3.4 (95% CI: 2.8–4.1) in Connecticut to 16.5 (95% CI: 13.4–19.6) in South Dakota, differed significantly across all states, with the highest values observed in South Dakota, Vermont, Michigan, and Wyoming, which were in the top 90th percentile, and the lowest values in Connecticut and Massachusetts, which were in the bottom 10th percentile [
States - Older adults
For individuals aged 65 and over, the AAMR varied from 11.4 (with a 95% CI of 8.5–15.0) in Hawaii to 38.3 (with a 95% CI of 34.8–41.7) in Colorado. The AAMR in states such as Texas, Oregon, Colorado, and California, which were in the top 90th percentile, was more than 3 times higher than that in states such as Massachusetts, Hawaii, Florida, and Delaware, which were in the bottom 10th percentile [
Census region: Newborn to younger adults
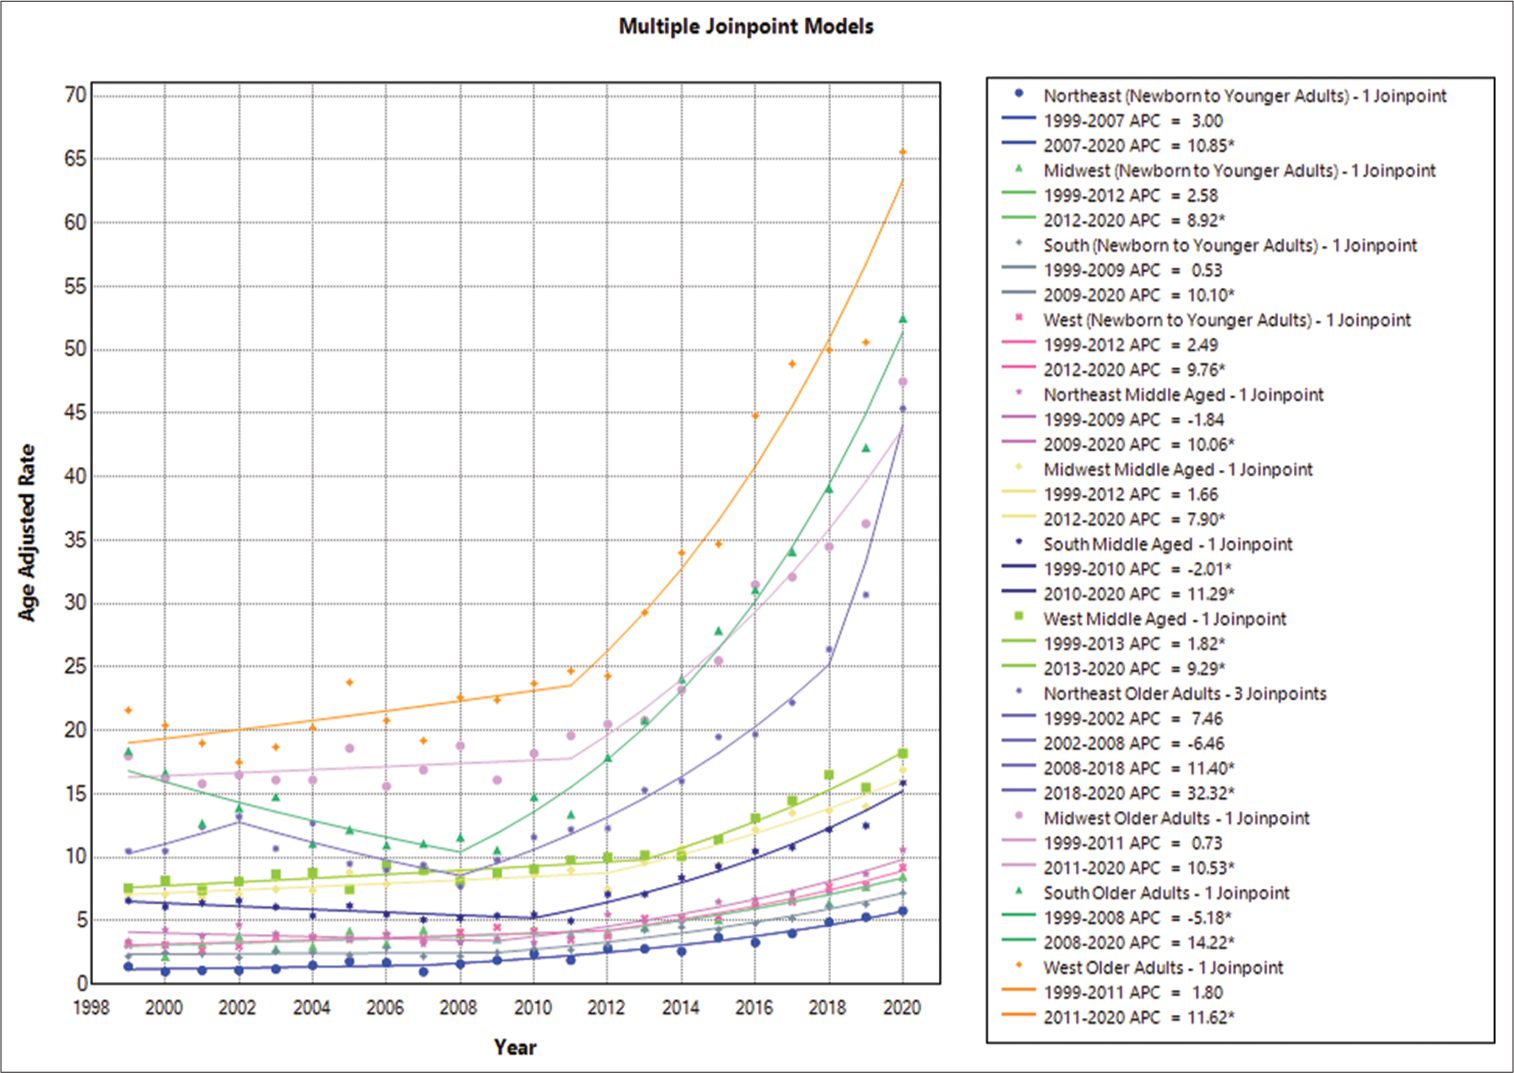
The Western region had the greatest death rate throughout the study period, at 4.8 (95% CI: 4.6–4.9), followed by the Midwestern region at 4.5 (95% CI: 4.4–4.7), the Southern region at 3.6 (95% CI: 3.5–3.7), and the Northeastern region at 2.5 (95% CI: 2.3–2.6). In summary, the Western region’s AAMR increased between 1999 and 2012, with an APC of 2.4853 (95% CI: −0.3934–4.1655). AAMRs increased significantly between 2012 and 2020 (APC of 9.7581, 95% CI: 7.2047–16.3046). Between 1999 and 2012, the Midwestern region’s AAMR climbed consistently, with an APC of 2.5850 (95% CI: −6.4413–4.6854), which then showed a further increase with an APC of 8.9186 (95% CI: 5.6160–22.2300) from 2012 to 2020. The AAMR in the Southern region initially declined from 1999 to 2009, with an APC of 0.5261 (95% CI: −4.0527–3.2322), but then showed an increase with an APC of 10.1040 (95% CI: 8.4217–13.4707) from 2009 to 2020. Finally, the AAMR in the Northeastern region showed a significant increase with an APC of 2.9995 (95% CI: −16.4385–9.1995) during the 1999–2007 period. This was followed by a further significant increase until 2020, with an APC of 10.8459 (95% CI: 8.5056–23.0045) [
Census region: Middle-aged adults
Among individuals aged 35–64 years, the highest mortality rate was observed in the Western region at 10.7/1000 population (95% CI: 10.5–11), followed by the Midwestern region at 9.7/1000 population (95% CI: 9.4–10), the Southern region at 7.9/1000 population (95% CI: 7.7–8), and the Northeastern region at 5.1/1000 population (95% CI: 4.9–5.3). In summary, the age-adjusted mortality rate (AAMR) in the western region showed an increasing trend from 1999 to 2013, with an APC of 1.8168 (95% CI: 0.5533–2.8253). This trend continued between 2013 and 2020, with an APC of 9.2882 (95% CI: 7.3245–12.6445). The AAMR in the Midwestern region increased from 1999 to 2012, with an APC of 1.6631 (95% CI: −0.7636–3.0376), which then showed a significant increase with an APC of 7.8958 (95% CI: 5.7550–13.0807). The Southern region’s AAMR decreased between 1999 and 2010 (APC = −2.0062, 95% CI: −4.0373–−0.3665) and then increased between 2010 and 2020 (APC = 11.2939, 95% CI: 9.7546–13.4050). Finally, the Northeastern region’s AAMR from 1999 to 2009 showed a decline with an APC of −1.8372 (95% CI: −7.9218– 1.5804) and then an increase until 2020 with an APC of 10.0640 (95% CI: 7.8012–14.6558) [
Census region: Older adults
The West region had the greatest mortality rate (32.1, 95% CI: 31.3–32.9) among people aged 65 and above, followed by the Midwestern region (23.3, 95% CI: 22.6–23.9), Southern region (22.8, 95% CI: 22.3–23.3), and Northeastern region (16.5, 95% CI: 15.9–17.1). In summary, the western region’s AAMR increased from 1999 to 2011, with an annual percentage change (APC) of 1.7984 (95% CI: −1.3098– 3.8437). This increase persisted between 2011 and 2020, with an APC of 11.6213 (95% CI: 9.6880–15.0780). From 1999 to 2011, the AAMR for the Midwestern area fell with an APC of 0.7257 (95% CI: −1.3645–2.3142) but then increased significantly with an APC of 10.5283 (95% CI: 8.8379–13.2260) between 2011 and 2020. With an APC of −5.1822 (95% CI: −8.2784–−2.6988), the AAMR for the Southern area fell between 1999 and 2008; however, from 2008 and 2020, it grew with an APC of 14.2170 (95% CI: 13.1276– 15.8664). With an initial increase from 1999 to 2002 (APC: 7.4610, 95% CI: −3.0250–25.8201) and a subsequent fall from 2002 to 2008 (APC: −6.4622, 95% CI: −17.0579–18.8307), the AAMR for the Northeastern area showed a changing trend. An increase was seen between 2008 and 2018, with an APC of 11.4012 (95% CI: 5.2262–13.9582), and between 2018 and 2020, there was an additional increase of 32.3161 (95% CI: 20.0965–40.2359) [
Urbanization - Newborn to younger adults
During the study period, the AAMR for epilepsy was consistently higher in nonmetropolitan areas, with an overall AAMR of 4.3 (95% CI: 4.1–4.5), compared to metropolitan areas’ AAMRs of 3.8 (95% CI: 3.7–3.9). The nonmetropolitan APC of 2.6588 and 95% CI of −12.3286–6.2589 suggest that AAMR increased in nonmetropolitan areas between 1999 and 2011. AAMR continued to rise in subsequent years, peaking in 2020 with an APC of 9.3819 and a 95% CI of 5.6056–25.1289. In contrast, from 1999 to 2011, the AAMR in urban regions grew, with an APC of 2.6727 and a 95% CI of 0.4064–4.0848. However, the mortality trend in metropolitan regions increased significantly from 2011 to 2020, with an APC of 10.1376 (95% CI: 8.3016–13.9555) [
Urbanization - Middle-aged adults
Nonmetropolitan regions had higher total AAMR values in individuals aged 35–64 years, with a value of 10.4 (95% CI: 10.1–10.7), compared to metropolitan areas’ AAMR of 8 (95% CI: 7.9–8.1). Between 1999 and 2011, nonmetropolitan regions had an APC of 0.6693 with a 95% CI ranging from −1.1303 to 2.1639, indicating a decrease in mortality. However, from 2011 to 2020, there was an increase in mortality, with an APC of 12.1867 (95% CI: 10.4042–14.6994). Metropolitan regions, on the other hand, showed a declining trend in mortality, with an APC of −0.2217 and a 95% CI ranging from −1.1523 to 0.6452 between 1999 and 2010. Nonetheless, mortality increased from 2010 to 2020, with an APC of 8.4288 (95% CI: 7.6945–9.5738) [
Urbanization - Older adults
The results show that individuals aged 64 or above residing in nonmetropolitan regions had a higher AAMR (26.4, 95% CI: 25.6–27.1) compared to those living in metropolitan areas (23.0, 95% CI: 22.6–23.3). As for APC values, nonmetropolitan regions demonstrated a declining trend from 1999 to 2007, with an APC of −3.6294 (95% CI: −9.0118–−1.4803). However, this trend reversed from 2007 to 2013, with an APC of 5.1926 (95% CI: −0.0878–11.2080). This upward trend persisted until 2020, with an APC of 14.8163 (95% CI: 13.0433–19.3884). In contrast, metropolitan areas experienced a decline in mortality rates from 1999 to 2009, with an APC of −1.0029 (95% CI: −3.1525–0.8046). This trend reversed from 2009 to 2020, with an APC of 12.3679 (95% CI: 11.3895−13.7544) [
DISCUSSION
Recurrent seizures are the hallmark of epilepsy, a neurological condition that poses a serious threat to worldwide public health. There is still a significant study vacuum concerning epilepsy-related mortality trends, especially when it comes to different demographic groups and geographical areas, despite the condition’s prevalence and potential for serious consequences, including death. To close this gap, this study examined mortality patterns associated with epilepsy in the US utilizing extensive data from the Centers for Disease Control and Prevention (CDC) covering more than 20 years, from 1999 to 2020.
Notable patterns in the fatality rates from epilepsy across different demographic and geographic groups over the research period were found by analyzing CDC data. The results showed that AAMRs were rising steadily in all age categories, with especially notable accelerations seen between 2011 and 2020. Across all age categories, males notably consistently showed greater AAMRs than females,[
The trend of increasing mortality due to epilepsy that has seen may have been caused by many variables. Over time, more precise identification and reporting of deaths associated with Epilepsy is probably going to be facilitated by advancements in awareness, diagnostic methods, and reporting systems.[
Although these findings shed light on variations in epilepsy-related mortality, it is crucial to acknowledge the several limitations of the research. Since the CDC mortality data used in this research were aggregated, there is a possibility that some epilepsy-related fatalities were misreported, incorrectly categorized, or reported unfairly. Moreover, the research disregarded factors at the individual level, such as medication adherence and lifestyle decisions, that may have an impact on how epilepsy develops. Moreover, neither the efficacy of therapies in lowering mortality rates nor the underlying causes of fatalities due to epilepsy were investigated in this study. To overcome these constraints and get a deeper understanding of the intricate factors influencing mortality due to epilepsy, future research should carry out longitudinal studies and incorporate individual-level data.
Subsequent investigations have to concentrate on mitigating these constraints and investigating the elements impacting death patterns associated with epilepsy. To evaluate changes in death rates over time and pinpoint risk variables that may be changed, longitudinal research is required. Further research is necessary to determine how differences in health-care access affect the management of epilepsy and death rates, especially in marginalized communities. Therefore, it is important to look into the effectiveness of treatments intended to improve epilepsy care and reduce death rates. With a greater knowledge of the evolving picture of epilepsy-related mortality, policymakers, health-care professionals, and researchers may collaborate to devise targeted interventions to reduce the burden of epilepsy on affected individuals and communities.
CONCLUSION
This study provides valuable insights into epilepsy-related mortality trends in the U.S., highlighting the significant increase in mortality rates across different demographic groups and geographic regions. Addressing the underlying factors contributing to these trends requires a multifaceted approach that includes improving access to health care, addressing socioeconomic disparities, and enhancing epilepsy management strategies. By addressing these challenges, we can work toward reducing the burden of epilepsy and improving outcomes for affected individuals, ultimately enhancing public health and well-being.
Ethical approval
Institutional Review Board approval is not required.
Declaration of patient consent
Patient’s consent is not required as there are no patients in this study.
Financial support and sponsorship
Nil.
Conflicts of interest
There are no conflicts of interest.
Use of artificial intelligence (AI)-assisted technology for manuscript preparation
The authors confirm that there was no use of artificial intelligence (AI)-assisted technology for assisting in the writing or editing of the manuscript and no images were manipulated using AI.
Supplementary data available on:
Disclaimer
The views and opinions expressed in this article are those of the authors and do not necessarily reflect the official policy or position of the Journal or its management. The information contained in this article should not be considered to be medical advice; patients should consult their own physicians for advice as to their specific medical needs.
References
1. Abe K, Taira T. Focused ultrasound treatment, present and future. Neurol Med Chir (Tokyo). 2017. 57: 386-91
2. Alanis-Guevara IA, Peña E, Corona T, López-Ayala T, LópezMeza E, López-Gómez M. Sleep disturbances, socioeconomic status, and seizure control as main predictors of quality of life in epilepsy. Epilepsy Behav. 2005. 7: 481-5
3. Beghi E. The epidemiology of epilepsy. Neuroepidemiology. 2020. 54: 185-91
4. Burneo JG, Tellez-Zenteno J, Wiebe S. Understanding the burden of epilepsy in Latin America: A systematic review of its prevalence and incidence. Epilepsy Res. 2005. 66: 63-74
5. DeGiorgio CM, Curtis AT, Hertling D, Kerr WT, Markovic D. Changes in epilepsy causes of death: A US population study. Acta Neurol Scand. 2021. 144: 478-85
6. Devinsky O, Cilio MR, Cross H, Fernandez-Ruiz J, French J, Hill C. Cannabidiol: Pharmacology and potential therapeutic role in epilepsy and other neuropsychiatric disorders. Epilepsia. 2014. 55: 791-802
7. Elkommos S, Mula M. Current and future pharmacotherapy options for drug-resistant epilepsy. Expert Opin Pharmacother. 2022. 23: 2023-34
8. Fisher RS, Acevedo C, Arzimanoglou A, Bogacz A, Cross JH, Elger CE. ILAE official report: A practical clinical definition of epilepsy. Epilepsia. 2014. 55: 475-82
9. Giussani G, Bianchi E, Beretta S, Carone D, DiFrancesco JC, Stabile A. Comorbidities in patients with epilepsy: Frequency, mechanisms and effects on long-term outcome. Epilepsia. 2021. 62: 2395-404
10. Greenlund SF, Croft JB, Kobau R. Epilepsy by the numbers: Epilepsy deaths by age, race/ethnicity, and gender in the United States significantly increased from 2005 to 2014. Epilepsy Behav. 2017. 69: 28-30
11. Hectors SJ, Jacobs I, Moonen CT, Strijkers GJ, Nicolay K. MRI methods for the evaluation of high intensity focused ultrasound tumor treatment: Current status and future needs. Magn Reson Med. 2016. 75: 302-17
12. Kobau R, Luncheon C, Greenlund K. Active epilepsy prevalence among U.S. Adults is 1.1% and differs by educational level-National Health Interview Survey, United States, 2021. Epilepsy Behav. 2023. 142: 109180
13. Kwan P, Brodie MJ. Early identification of refractory epilepsy. N Engl J Med. 2000. 342: 314-9
14. Lescrauwaet E, Vonck K, Sprengers M, Raedt R, Klooster D, Carrette E. Recent advances in the use of focused ultrasound as a treatment for epilepsy. Front Neurosci. 2022. 16: 886584
15. Mac TL, Tran DS, Quet F, Odermatt P, Preux PM, Tan CT. Epidemiology, aetiology, and clinical management of epilepsy in Asia: A systematic review. Lancet Neurol. 2007. 6: 533-43
16. Mbizvo GK, Bennett KH, Schnier C, Simpson CR, Duncan SE, Chin RF. The accuracy of using administrative healthcare data to identify epilepsy cases: A systematic review of validation studies. Epilepsia. 2020. 61: 1319-35
17. Morano A, Fanella M, Albini M, Cifelli P, Palma E, Giallonardo AT. Cannabinoids in the treatment of epilepsy: Current status and future prospects. Neuropsychiatr Dis Treat. 2020. 16: 381-96
18. Mula M, Cock HR. More than seizures: Improving the lives of people with refractory epilepsy. Eur J Neurol. 2015. 22: 24-30
19. Perucca E. The pharmacological treatment of epilepsy: Recent advances and future perspectives. Acta Epileptologica. 2021. 3: 22
20. Pontes Silva R, Gama Marques J. The homeless, seizures, and epilepsy: A review. J Neural Transm (Vienna). 2023. 130: 1281-9
21. Preux PM, Druet-Cabanac M. Epidemiology and aetiology of epilepsy in sub-Saharan Africa. Lancet Neurol. 2005. 4: 21-31
22. Queeny IP, Malone DC, Chong J, Harris RB, Labiner DM. An update on the prevalence and incidence of epilepsy among older adults. Epilepsy Res. 2018. 139: 107-12
23. Sapkota S, Kobau R, Pastula DM, Zack MM. Close to 1 million US adults aged 55 years or older have active epilepsy-National Health Interview Survey 2010, 2013, and 2015. Epilepsy Behav. 2018. 87: 233-4
24. Sen A, Jette N, Husain M, Sander JW. Epilepsy in older people. Lancet. 2020. 395: 735-48
25. Senn L, Cannazza G, Biagini G. Receptors and channels possibly mediating the effects of phytocannabinoids on seizures and epilepsy. Pharmaceuticals. 2020. 13: 174
26. Tong J, Ji T, Liu T, Liu J, Chen Y, Li Z. Efficacy and safety of six new antiseizure medications for adjunctive treatment of focal epilepsy and epileptic syndrome: A ystematic review and network meta-analysis. Epilepsy Behav. 2024. 152: 109653
27. Weatherburn CJ, Heath CA, Mercer SW, Guthrie B. Physical and mental health comorbidities of epilepsy: Population-based cross-sectional analysis of 1.5 million people in Scotland. Seizure. 2017. 45: 125-31
28. Wilner AN, Sharma BK, Thompson A, Soucy A, Krueger A. Diagnoses, procedures, drug utilization, comorbidities, and cost of health care for people with epilepsy in 2012. Epilepsy Behav. 2014. 41: 83-90
29. Zack MM. National and state estimates of the numbers of adults and children with active epilepsy-United States, 2015. MMWR Morb Mortal Wkly Rep. 2017. 66: 821-5
30. Zareie P, Sadegh M, Palizvan MR, Moradi-Chameh H. Anticonvulsive effects of endocannabinoids; An investigation to determine the role of regulatory components of endocannabinoid metabolism in the pentylenetetrazol induced tonic-clonic seizures. Metab Brain Dis. 2018. 33: 939-48


