- Department of Neurosurgery, Harasanshin Hospital,
- Department of Neurosurgery, Graduate School of Medical Sciences, Kyushu University,
- Departments of Neurology, Harasanshin Hospital,
- Radiology, Harasanshin Hospital,
- Department of Clinical Chemistry and Laboratory Medicine, Kyushu University Hospital,
- Department of Neurology, Graduate School of Medical Sciences, Kyushu University, Fukuoka, Japan.
Correspondence Address:
Takafumi Shimogawa, Department of Neurosurgery, Graduate School of Medical Sciences, Kyushu University, 3-1-1 Maidashi, Higashi-ku, Fukuoka 812-8582, Japan.
DOI:10.25259/SNI_841_2021
Copyright: © 2022 Surgical Neurology International This is an open-access article distributed under the terms of the Creative Commons Attribution-Non Commercial-Share Alike 4.0 License, which allows others to remix, transform, and build upon the work non-commercially, as long as the author is credited and the new creations are licensed under the identical terms.How to cite this article: Katsuhiro Goto1, Takafumi Shimogawa2, Nobutaka Mukae2, Tadahisa Shono1, Fujio Fujiki3, Atsuo Tanaka4, Ayumi Sakata5, Hiroshi Shigeto6, Koji Yoshimoto2, Takato Morioka1. Implications and limitations of magnetic resonance perfusion imaging with 1.5-Tesla pulsed arterial spin labeling in detecting ictal hyperperfusion during non-convulsive status epileptics. 15-Apr-2022;13:147
How to cite this URL: Katsuhiro Goto1, Takafumi Shimogawa2, Nobutaka Mukae2, Tadahisa Shono1, Fujio Fujiki3, Atsuo Tanaka4, Ayumi Sakata5, Hiroshi Shigeto6, Koji Yoshimoto2, Takato Morioka1. Implications and limitations of magnetic resonance perfusion imaging with 1.5-Tesla pulsed arterial spin labeling in detecting ictal hyperperfusion during non-convulsive status epileptics. 15-Apr-2022;13:147. Available from: https://surgicalneurologyint.com/?post_type=surgicalint_articles&p=11536
Date of Submission
21-Aug-2021
Date of Acceptance
22-Mar-2022
Date of Web Publication
15-Apr-2022
Abstract
Background: Recent our reports showed that 3-T pseudocontinuous arterial spin labeling (3-T pCASL) magnetic resonance perfusion imaging with dual post labeling delay (PLD) of 1.5 and 2.5 s clearly demonstrated the hemodynamics of ictal hyperperfusion associated with non-convulsive status epilepticus (NCSE). We aimed to examine the utility of 1.5-T pulsed arterial spin labeling (1.5-T PASL), which is more widely available for daily clinical use, for detecting ictal hyperperfusion.
Methods: We retrospectively analyzed the findings of 1.5-T PASL with dual PLD of 1.5 s and 2.0 s in six patients and compared the findings with ictal electroencephalographic (EEG) findings.
Results: In patients 1 and 2, we observed the repeated occurrence of ictal discharges (RID) on EEG. In patient 1, with PLDs of 1.5 s and 2.0 s, ictal ASL hyperperfusion was observed at the site that matched the RID localization. In patient 2, the RID amplitude was extremely low, with no ictal ASL hyperperfusion. In patient 3 with lateralized periodic discharges (LPD), we observed ictal ASL hyperperfusion at the site of maximal LPD amplitude, which was apparent at a PLD of 2.0 s but not 1.5 sec. Among three patients with rhythmic delta activity (RDA) of frequencies
Conclusion: The detection of ictal hyperperfusion on 1.5-T PASL might depend on the electrophysiological intensity of the epileptic ictus, which seemed to be more prominent on 1.5-T PASL than on 3-T pCASL. The 1.5-T PASL with dual PLDs showed the hemodynamics of ictal hyperperfusion in patients with RID and LPD. However, it may not be visualized in patients with extremely low amplitude RID or RDA (frequencies
Keywords: Arterial spin labeling, Ictal hyperperfusion, Non-convulsive status epilepticus, Post labeling delay
INTRODUCTION
Arterial spin labeling (ASL) is a neuroimaging technique that noninvasively quantifies cerebral blood flow (CBF). Acting as a diffusible tracer, water proton nuclear spins in the arterial blood are labeled by the application of a radiofrequency (RF) pulse that inverts them at the level of cervical arteries.[
There are two distinct labeling methods for the clinical use of ASL,[
The use of pCASL with 3-T provides valuable information about the circulatory changes associated with nonconvulsive status epilepticus (NCSE).[
However, there are very few reports on the detection of ictal ASL hyperperfusion in general clinical practices. The most likely reason is the underutilization of pCASL because of its incompatibility with MRI scanners.[
We aimed to examine the implications and limitations of PASL imaging with 1.5-T for detecting ictal hyperperfusion during NCSE, with reference to ictal electroencephalographic (EEG) findings, which is the gold standard in NCSE diagnosis. To overcome the limitation of the inability to evaluate slowly streaming CBF, we developed a simple ASL technique using the dual PLD method. We selected another PLD of 2.5 s, in addition to the routinely used PLD of 1.5 sec.[
MATERIALS AND METHODS
Patients
From April 2020 to May 2021, 52 patients underwent the control of epilepsy as neuroemergency cases or postoperatively at our hospital. Most of the patients underwent neuroradiological examinations such as computed tomography or conventional MRI combined with routine EEG. In nine (17.3%) of 52 patients, PASL sequences were added to the conventional MRI examination for clinical purposes, depending on the patient’s condition and at the discretion of the attending physicians.
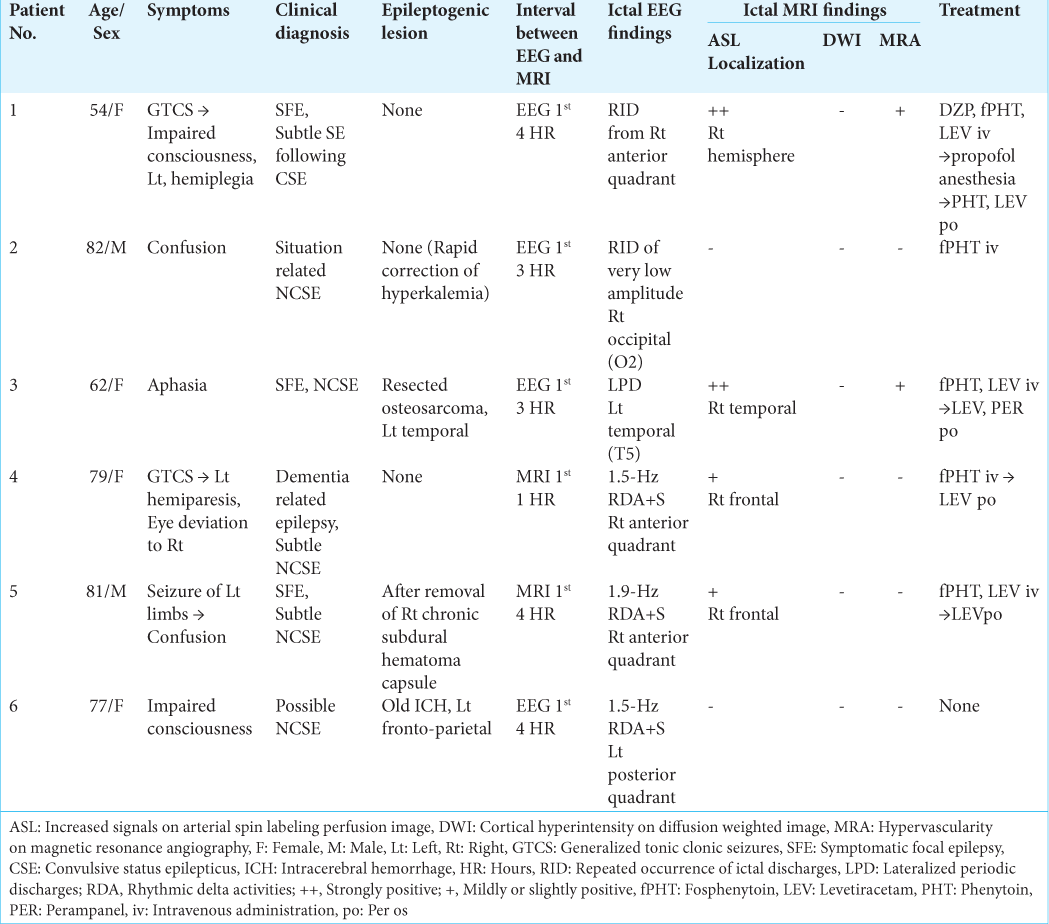
We retrospectively selected six of these nine patients (three women and three men; mean age, 72.5 years; range, 54– 81 years), who underwent both ASL and routine EEG during both ictal and interictal states of NCSE [
Ethics approval was obtained from the institutional review board of the Harasanshin Hospital (No. 2021-10). The need for written informed consent was waived because of the retrospective study design.
Methods
ASL imaging
MRI was performed using a 1.5-T scanner (MAGNETOM Aera; Siemens, Erlangen, Germany), equipped with a 20-channel head/neck coil. A 3-D turbo gradient spin echo and a pulsed ASL protocol were used in this study. Other acquisition parameters were as follows: phase encoding in the z direction=24, time to repeat =3000 ms, TE =17.18 ms, FOV =220 mm, matrix =64 × 52, slice thickness=3 mm, and number of slices =48. Two PLDs (inversion time) of 1500 ms (1.5 s) and 1990 ms (2.0 s) were selected. The ASL acquisition times for each PLD were 2 min and 30 s.
The evaluation of ASL findings was based on visual inspection by a board-certified radiologist (A.T.) and neurosurgeon (T.S.), blinded to the clinical data. No differences in their interpretations were observed in the independent assessments.
EEG
Routine EEG recordings were obtained using a digital EEG machine (Neurofa×1200; Nihon-Kohden, Tokyo, Japan), with electrode placement according to the International EEG 10–20 system. The evaluation of the EEG findings was based on visual inspection by two board-certified electroencephalographers (T.M. and H.S.) who were blinded to the clinical data. No differences in the electroencephalographers’ interpretations were recorded in the independent assessments. We followed the critical care EEG terminology proposed by the American Clinical Neurophysiological Society (ACNS).[
RESULTS
EEG and MRI findings of the patients
In two patients (Patients 1 and 2), we observed the repeated occurrence of ictal discharges (RID) on EEG, despite an extremely low RID amplitude in patient 2. In patient 1, ictal ASL hyperperfusion was observed at the site that matched the localization of RID. However, it was not observed in patient 2. In patient 3 with lateralized periodic discharges (LPD), ictal ASL hyperperfusion was observed at the site displaying the maximal LPD amplitude. Among three patients (Patients 4–6) with rhythmic delta activity (RDA) of frequencies <2.5 Hz, we observed an obvious and slight increase in ASL signals in patients 4 and 5, respectively; in these patients, NCSE could be diagnosed with subtle ictal phenomenon. However, increased signal was not observed in patient 6 with possible NCSE. The detailed clinical, EEG, and MRI findings of these six patients are summarized in [
Patients 1 and 2 with RID
Patient 1 developed repeated convulsive seizures due to nonlesional right frontal lobe epilepsy, predominantly in the left limbs, while changing the antiepileptic drugs. While the intravenous administration of diazepam, fosphenytoin, and levetiracetam was almost effective for convulsive seizures, her consciousness was impaired and left hemiplegia was observed. EEG showed RID, which began in the right anterior quadrant (Fp2, F4, and F8), and soon spread to the occipital (O2) and posterior temporal regions (T6). The ictal discharges eventually became secondarily generalized [
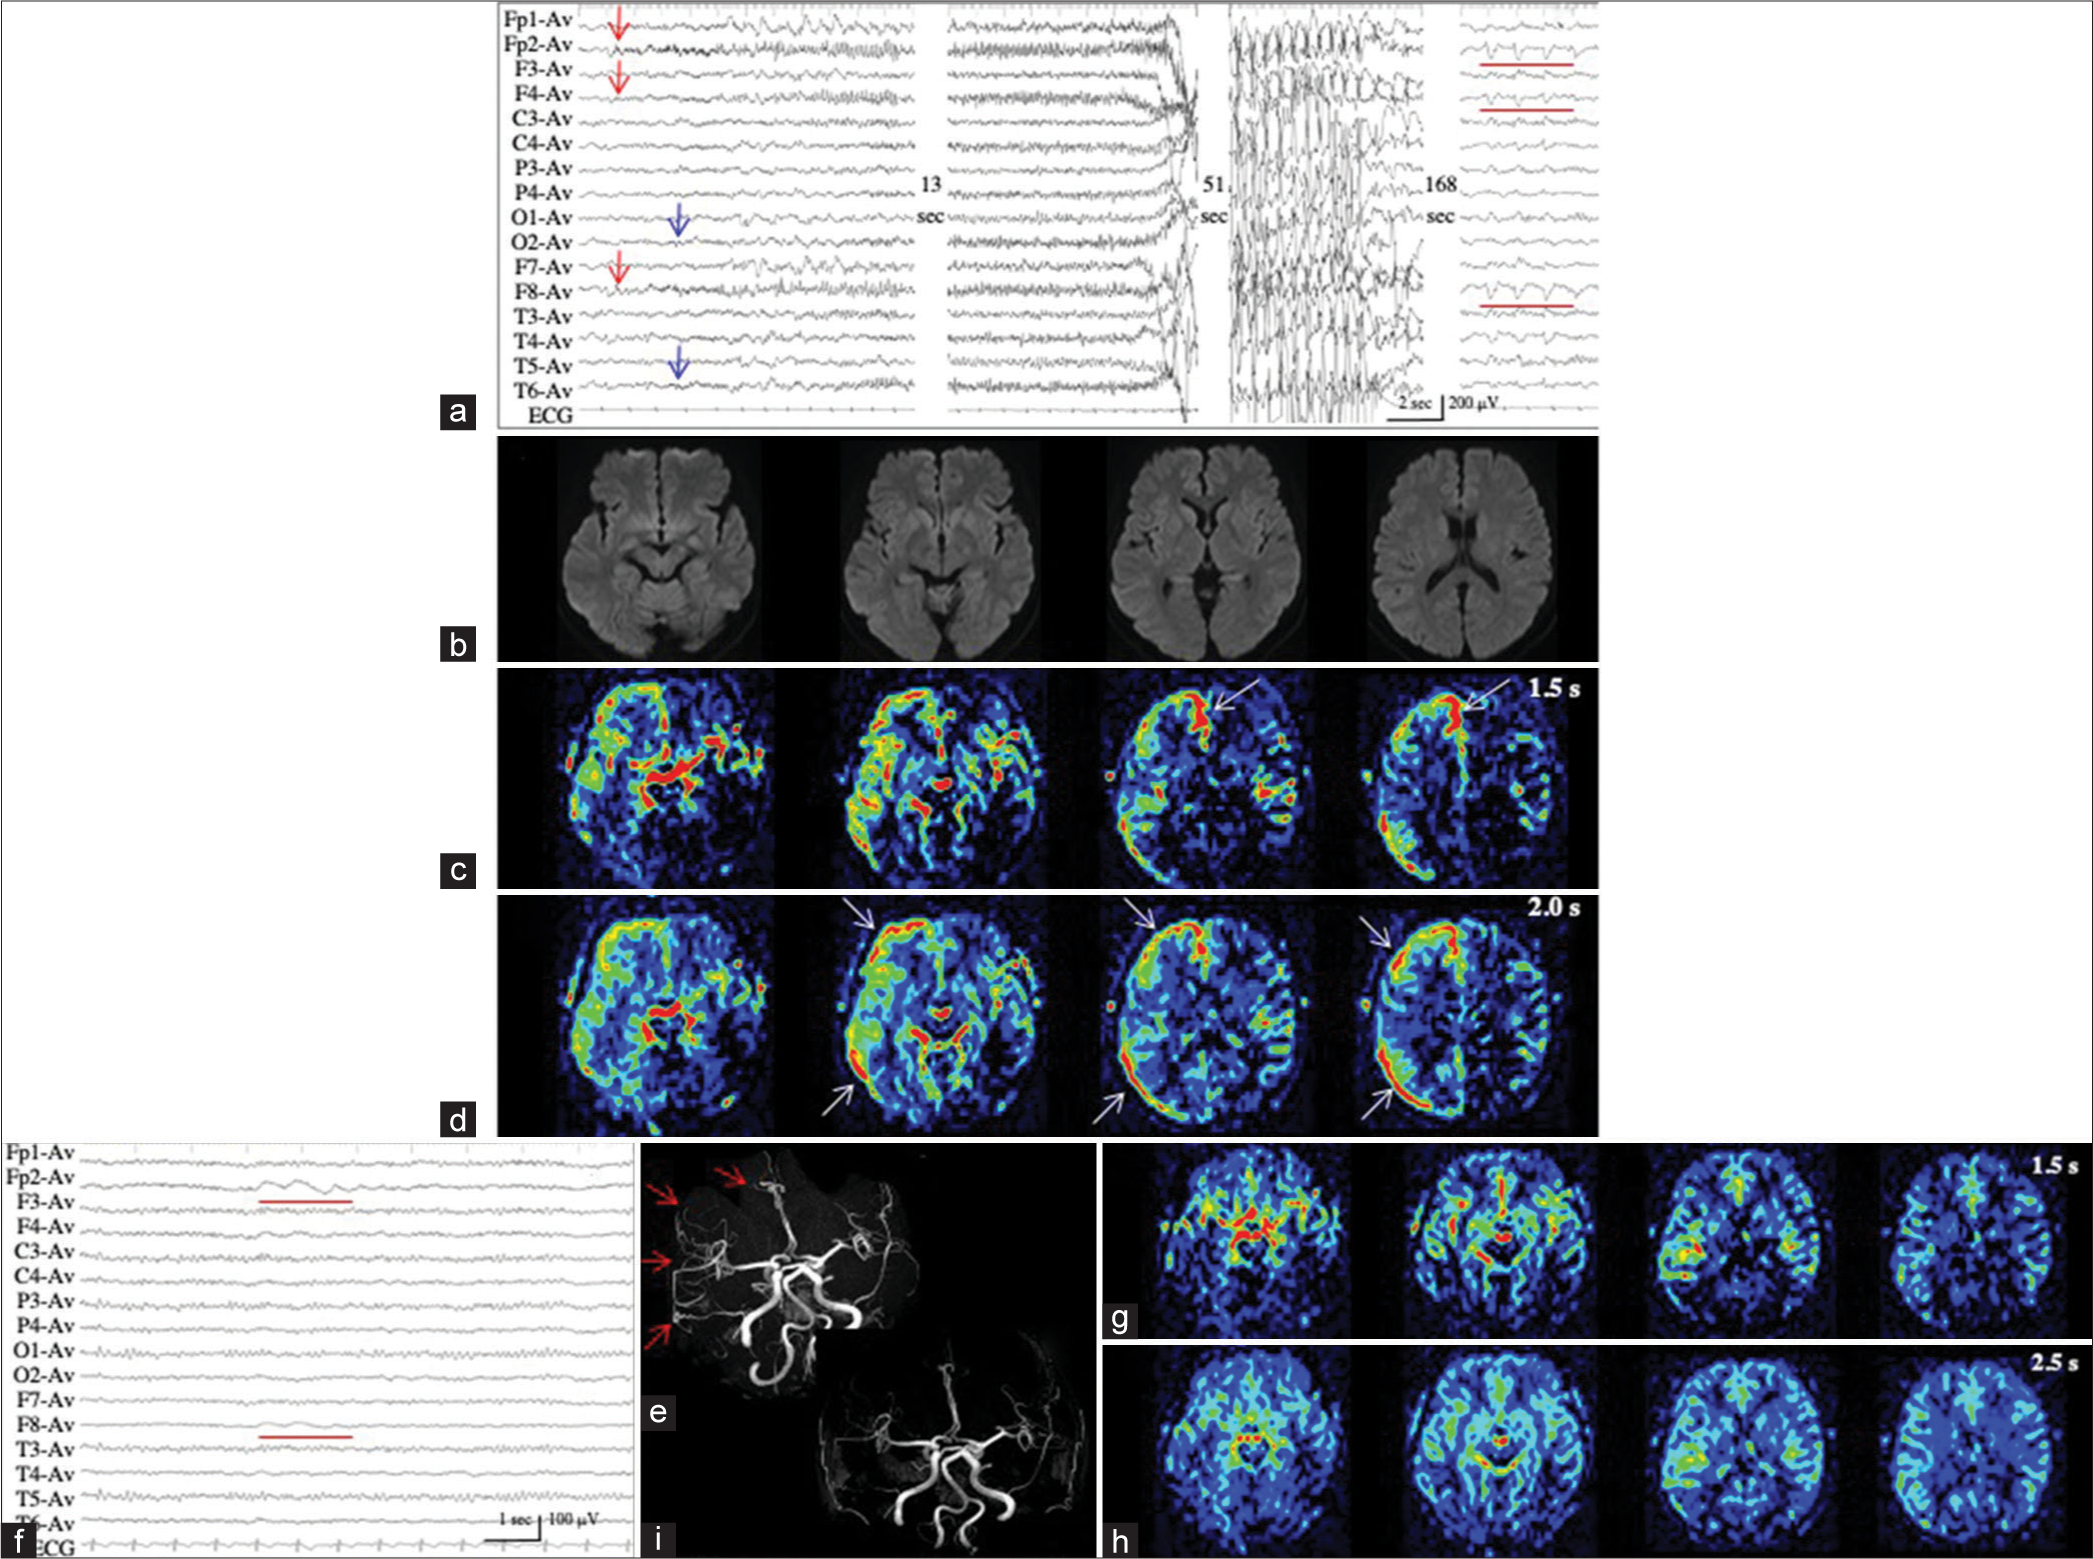
Figure 1:
Patient 1. (a) EEG during ictal periods shows that ictal discharges begin at the right anterior quadrant (red arrows, Fp2, F3, and F8 of International EEG 10–20 system), soon spread to the occipital (O2) and posterior temporal regions (T6) (blue arrows), and eventually become secondarily generalized. Postictally, periodic discharges are observed at the right anterior quadrant (red lines). (b) Diffusion weighted images fail to reveal an epileptogenic lesion or cortical hyperintensity. (c and d) PASL images with PLD of 1.5 s (c) and 2.0 s (d) reveal increased signals in the right frontal, posterior temporal, and parietal lobes. At PLD of 1.5 s, the ATA of intracranial major arteries, including Willis’s circle, is observed. The most prominent ASL signals are observed at the interhemispheric cortex of the right frontal lobe (white arrows in (c)). At PLD of 2.0 s, while ASL signals of the right frontal interhemispheric cortex are slightly decreased, those of right frontal, posterior temporal, and parietal convexity are slightly increased (white arrows in (d)). (e) Time-of-flight MRA shows increased vascularity at the peripheries of MCA and ACA (red arrows). (f) During interictal periods (2 weeks after (a)), EEG reveals intermittent slow wave activities in the right frontal region (red lines: Fp2, F4, and F8). The background activities of the right hemisphere are decreased. (g and h) Both on PASL with PLD of 1.5 s (g) and 2.0 s (h), the findings of ictal ASL hyperperfusion are improved. (i) MRA shows no increased vascularity at the peripheries of right MCA and ACA. EEG: Electroencephalogram, AV: Averaged reference, PASL: Pulsed arterial spin labeling, PLD: Post labeling delay, ATA: Arterial transit artifact, ASL: Arterial spin labeling, MRA: Magnetic resonance angiography, MCA: Middle cerebral artery, ACA: Anterior cerebral artery.
Patient 2 developed situation-related de novo NCSE, possibly induced by a rapid correction of hyperkalemia (from 9.84 mmol/L to 5.61 mmol/L in approximately 5 h) with glucose-insulin therapy and hemodialysis. We repeatedly recorded ictal activities of extremely low amplitude (<20 µV) with evolving frequencies in the right occipital region on EEG, with increased sensitivity 5 times the ordinary condition, and the maximal amplitude in O2 and P4 [
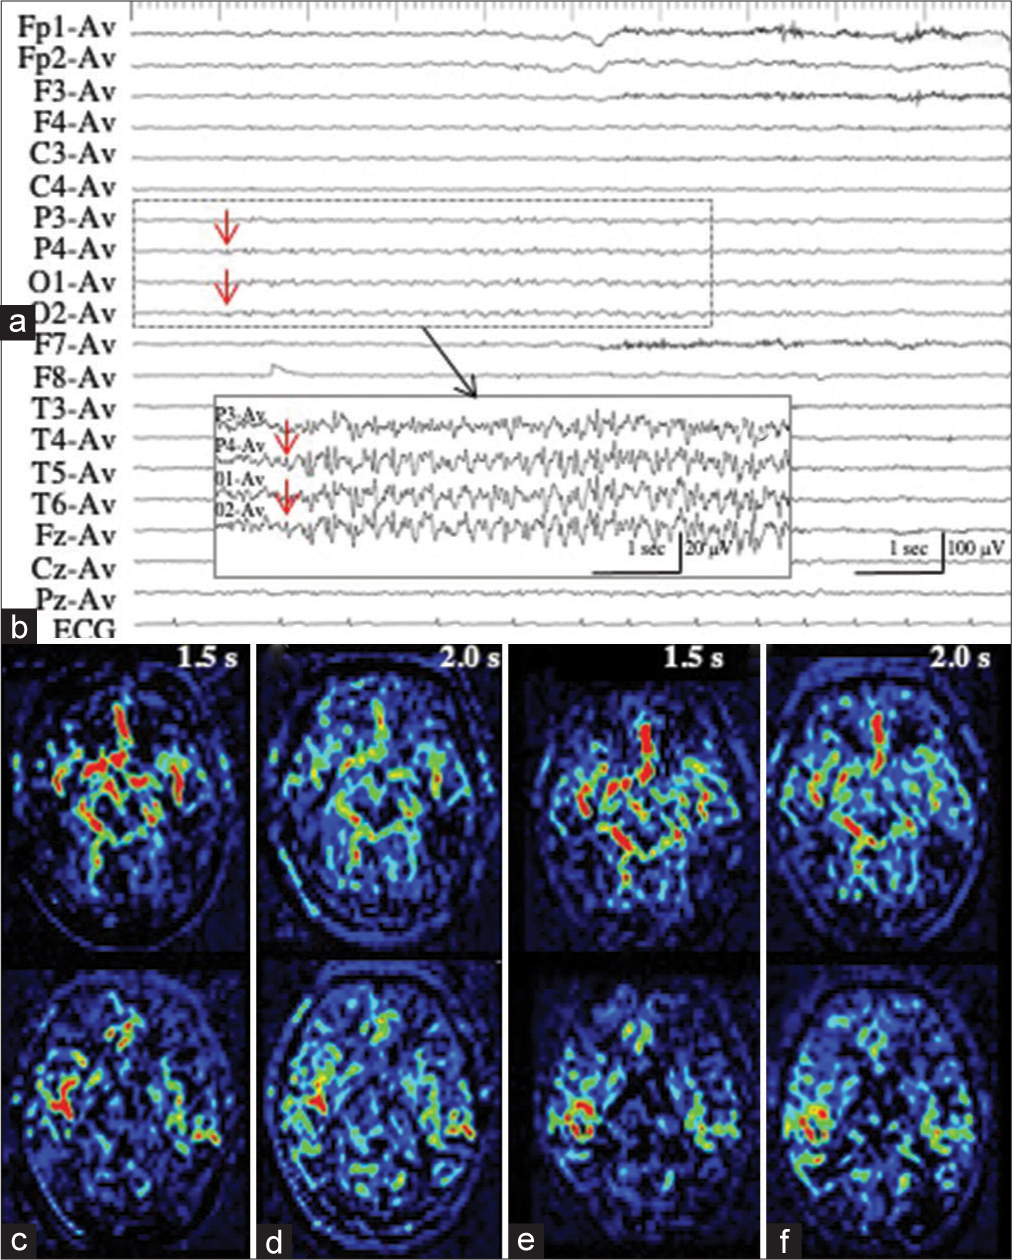
Figure 2:
Patient 2. (a, black arrow) During ictal periods, EEG shows ictal discharges of extremely low amplitude (<20 µV) in the right occipital region (red arrows). (b) EEG with increased sensitivity 5 times the ordinary condition clearly shows repeated occurrence of ictal discharges with evolving frequencies, with the maximal amplitude in 02 and P4 (red arrows). The area of EEG with increased sensitivity is indicated by the dotted square in (a, black arrow). (c and d) PASL images with PLD of 1.5 s (c) and 2.0 s (d) fail to reveal the ictal hyperperfusion in the right posterior cortex. (e and f) During interictal periods, PASL images with PLD of 1.5 s (e) and 2.0 s (f) show similar findings with those of ictal PASL. The ATA of the right posterior cerebral artery is slightly noticeable both on ictal (c and d) and interictal PASL images (e and f). EEG: Electroencephalogram, PASL: Pulsed arterial spin labeling, PLD: Post labeling delay, ATA: Arterial transit artifact.
Patient 3 with LPD
Patient 3 underwent en bloc total resection of osteosarcoma of the left temporal bone.[
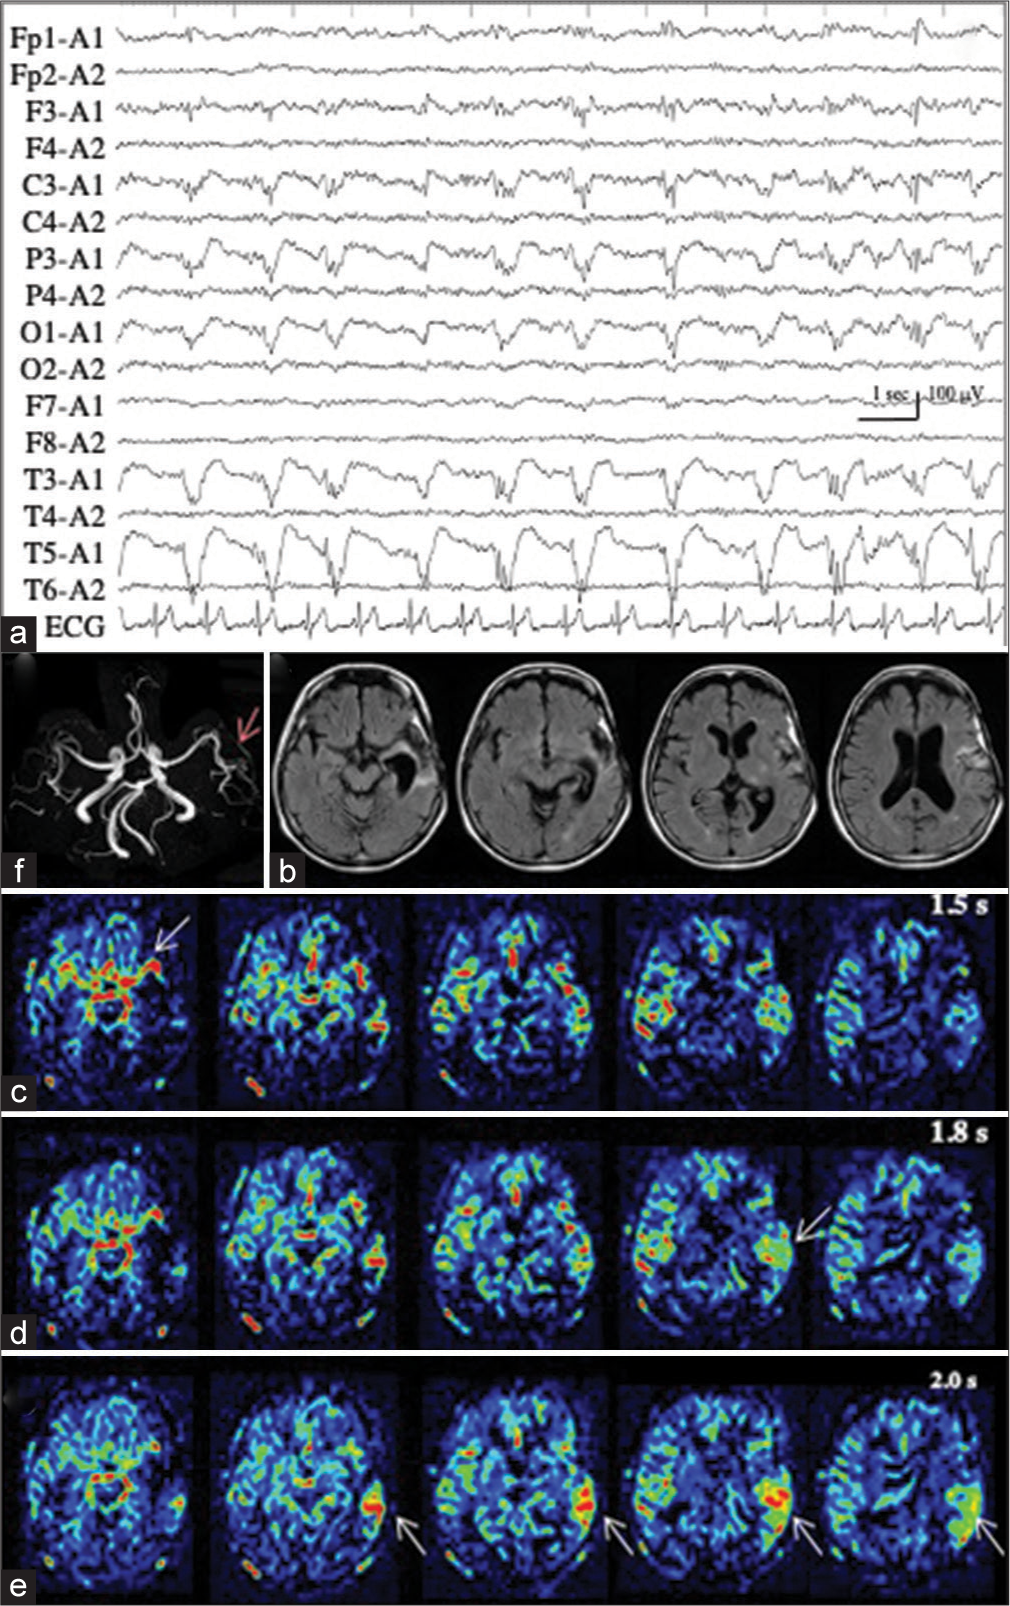
Figure 3:
Patient 3. (a) Ictal EEG shows LPD with the maximal amplitude on the posterior temporal region of T5. (b) MR images with fluid attenuated inversion recovery sequence show a surgical defect in the left temporal lobe, with enlargement of the inferior horn. (c-e) PASL images with PLD of 1.5 s (c), 1.8 s (d), and 2.0 s (e) clearly show the hemodynamics of ictal hyperperfusion. At PLD of 1.5 sec, when the ATA of major arteries, particularly left MCA, is prominent (white arrow in (c)), increased ASL signals of the left posterior temporal lobe, the postero-dorsal part of the resection cavity, is not apparent. The ASL signal of the left posterior temporal lobe is slightly increased at PLD of 1.8 s (white arrow in (d)), and apparently increased at PLD of 2.0 s (white arrows in (e)). ATA of major arteries is decreased. (f) MRA reveals the hypervascularity at the periphery of left MCA (red arrow). EEG: Electroencephalogram, LPD: Lateralized periodic discharges, MR: Magnetic resonance, PASL: Pulsed arterial spin labeling, PLD: Post labeling delay, MCA: Middle cerebral artery, ASL: Arterial spin labeling, ATA: Arterial transit artifact, MRA: Magnetic resonance angiography.
Patients 4–6 with RDA
Patient 4 had moderate dementia, developed generalized tonic-clonic seizures at the nursing home, and were admitted to our hospital. On arrival, while the seizure subsided, her consciousness was impaired. Moreover, we observed left hemiparesis and eye deviation to the right. EEG revealed 1.5-Hz RDA with sharp waves in the right anterior quadrant [
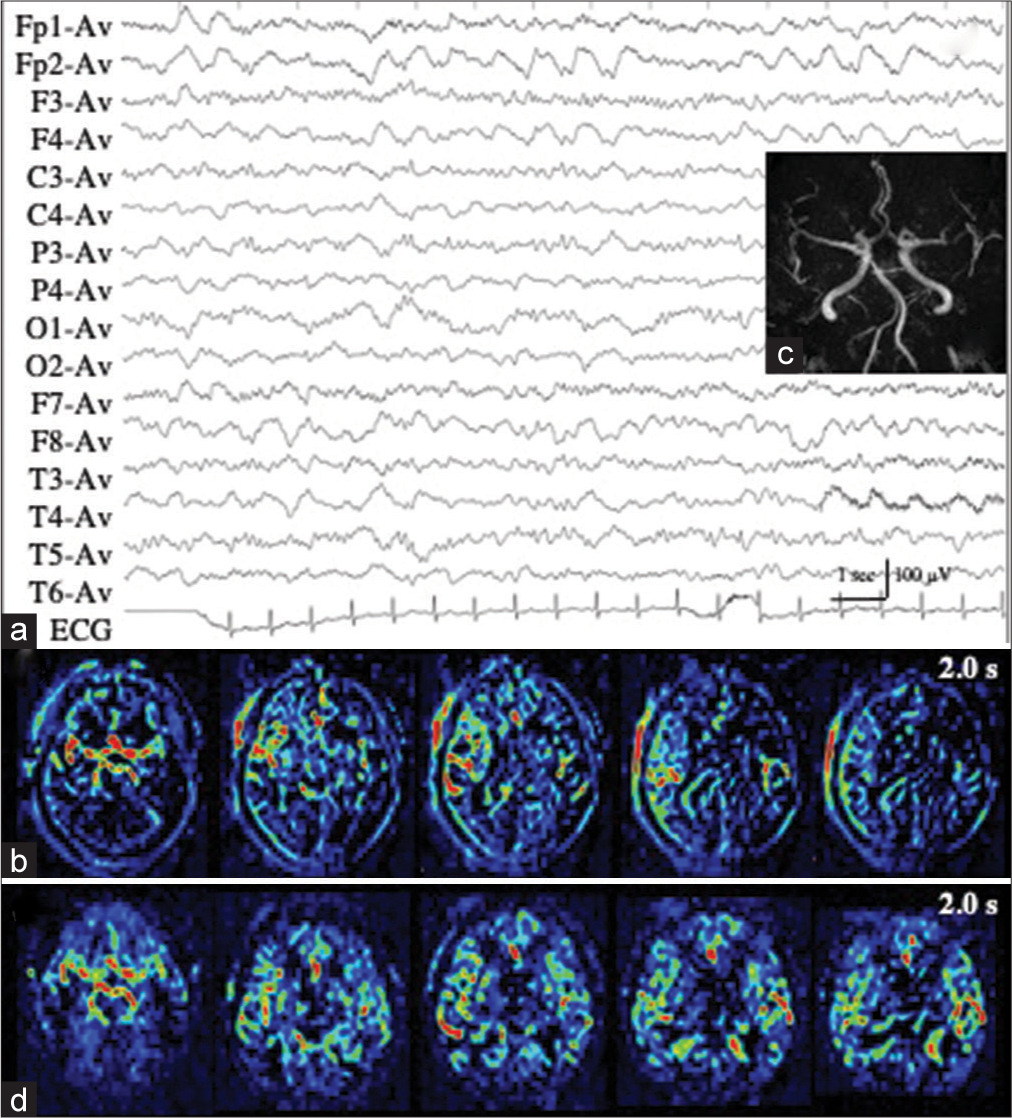
Figure 4:
Patient 4. (a) Ictal EEG reveals 1.5-Hz RDA with sharp waves in the right anterior quadrant. (b) PASL at PLD of 2.0 s shows obviously increased ASL signals in the right frontal lobe. ASL signals of the contralateral hemisphere are decreased. (c) On MRA, the hypervascularity is not apparent at the periphery of the right middle cerebral arteries. (d) On interictal PASL at PLD of 2.0 sec, the increased ASL signals are improved. PASL images at PLD of 1.5 s are not available because of technical failures, both on the ictal and interictal periods. EEG: Electroencephalogram, RDA: Rhythmic delta activities, PASL: Pulsed arterial spin labeling, PLD: Post labeling delay, MRA: Magnetic resonance angiography.
Patient 5 underwent right fronto-temporo-parietal craniotomy for the removal of the recurrent chronic subdural hematoma capsule. On postoperative day 2, he developed clonic seizures in his left limbs, followed by a state of confusion. EEG showed a 1.9-Hz RDA with sharp waves in the right anterior quadrant [
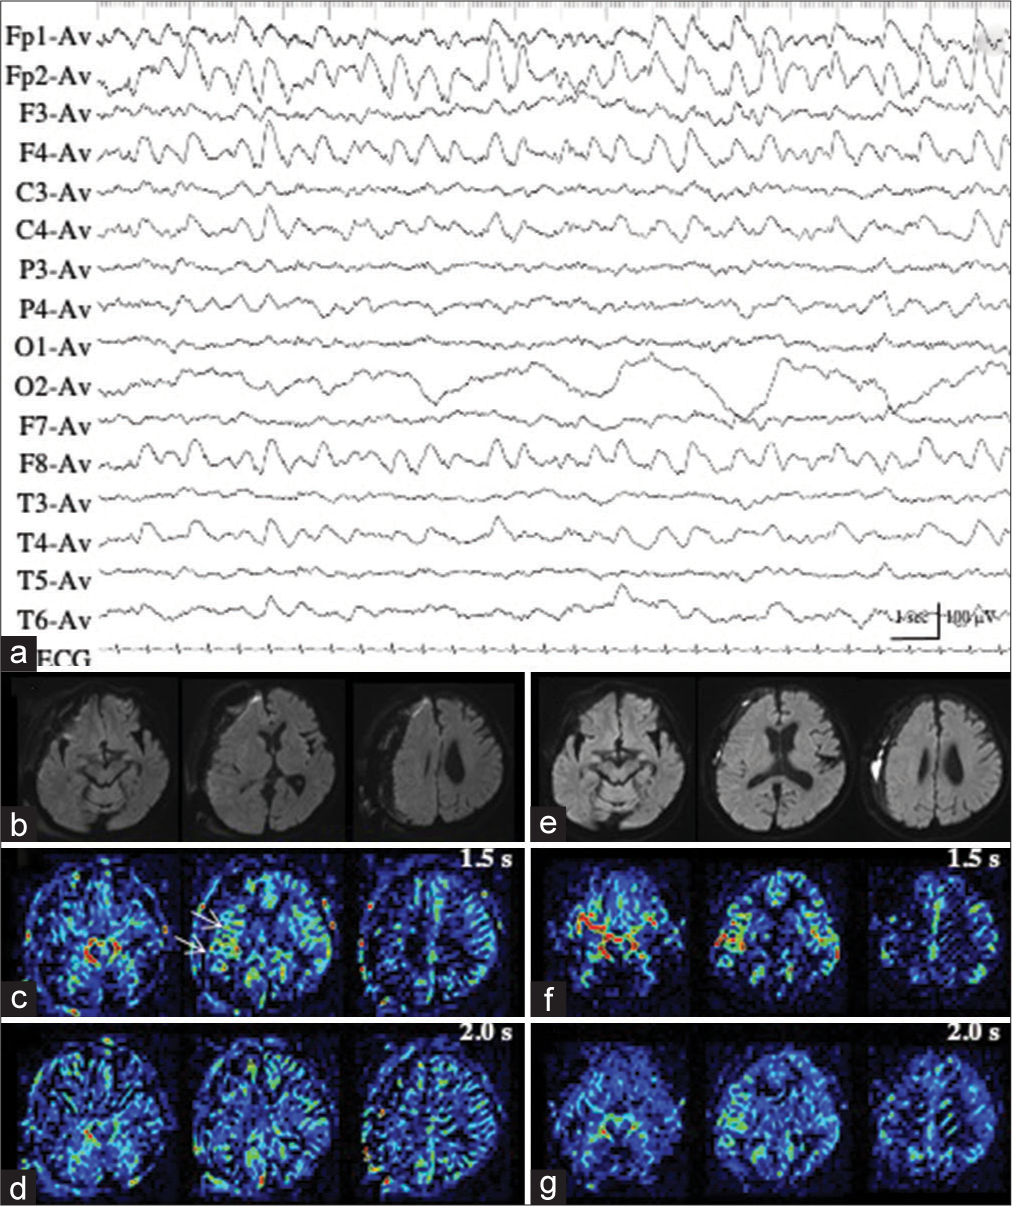
Figure 5:
Patient 5. (a) Ictal EEG shows 1.9-Hz rhythmic delta activity with sharp waves in the right anterior quadrant. (b) On diffusion weighted image, the deviation of right cerebral hemisphere is still persistent. However, no parenchymal change has been noted. (c) With PASL at PLD of 1.5 sec, slightly increased area has been observed in the right frontal lobe (white arrows). (d) This finding is not apparent on PASL at PLD of 2.0 s. (e) During interictal state (a month after (a)), DWI reveals slight improvement in the deviation of the right cerebral hemisphere. (f and g) No laterality of ASL signals is observed both on PASLs at PLD of 1.5 (f) and 2.0 s (g). EEG: Electroencephalogram, DWI: Diffusion weighted image, PASL: Pulsed arterial spin labeling, PLD: Post labeling delay.
Patient 6, who had an old hematoma cavity in the left fronto-parietal lobe, developed acute cerebellar infarction on the left side. Approximately 2 weeks after the onset of cerebellar infarction, his consciousness was impaired. EEG demonstrated a 1.5-Hz RDA with sharp waves in the left posterior quadrant, and a duration <10 s [
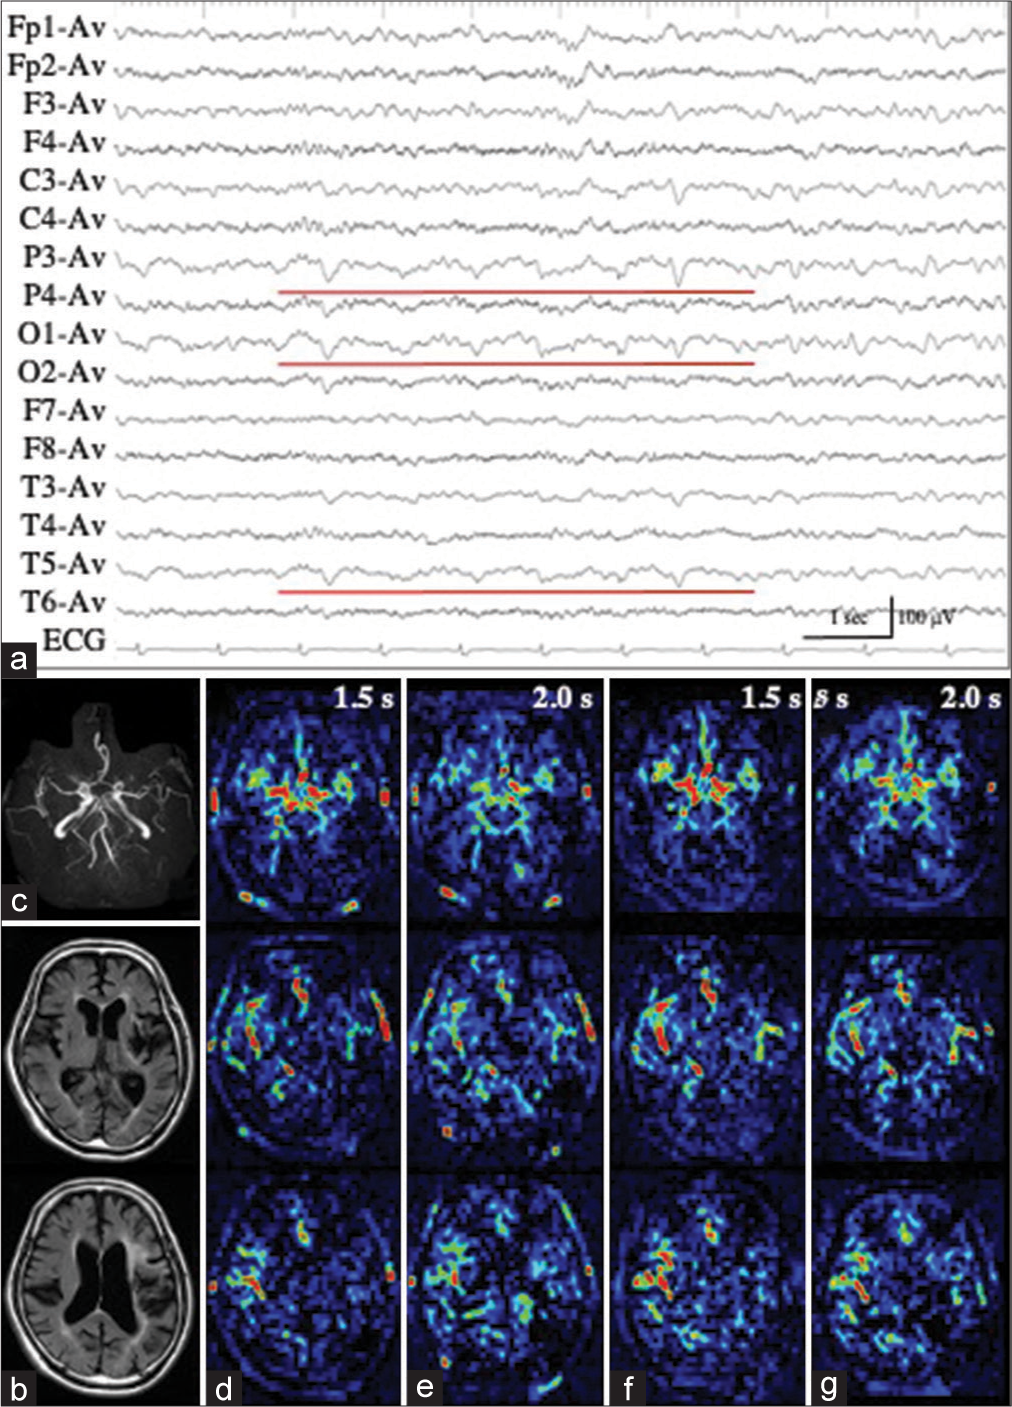
Figure 6:
Patient 6. (a) Ictal EEG shows 1.5-Hz rhythmic delta activity with sharp waves in the left posterior quadrant, and a duration <10 s (red lines). (b) Fluid attenuated inversion recovery images display an old hematoma cavity in the left fronto-parietal lobe but fail to reveal a de novo lesion. (c) MRA shows slightly poor visualization of the left MCA periphery because of the old intracerebral hematoma. (d-g) PASL with dual PLDs reveal mildly decreased ATA of the left MCA periphery, both during ictal (d and e) and interictal states (f and g). EEG: Electroencephalogram, MRA: Magnetic resonance angiography, MCA: Middle cerebral artery, PASL: Pulsed arterial spin labeling, PLD: Post labeling delay, ATA: Arterial transit artifact.
DISCUSSION
In this study, we used 1.5-T PASL to detect ictal hyperperfusion during NCSE in six patients. In Patients 1 and 3, 1.5-T PASL with dual PLDs of 1.5 s and 2.0 s showed the hemodynamics of ictal hyperperfusion, with a resolution comparable to that of 3-T pCASL with dual PLDs of 1.5 s and 2.5 s in our previous report.[
The ATA of the major arteries was one of the most prominent signals on 1.5-T PASL images, which makes tissue CBF difficult to assess.[
Previous our studies have shown that the detection of ictal hyperperfusion on 3-T pCASL depends on the electrophysiological intensity or power of the epileptic ictus.[
Nevertheless, ictal ASL hyperperfusion was not associated with the RID in patient 2 with situation-related NCSE. The amplitude of the RID was estimated to be “extremely low,” based on the critical care EEG terminology proposed by ACNS.[
However, there are few reports on ictal ASL hyperperfusion in NCSE cases presenting with RDA. In particular, Ohtomo et al.[
The present study had some limitations. First, we performed data acquisition through visual inspection and could not quantitatively evaluate the real CBF value with PASL. Second, we did not directly compare the diagnostic abilities of 1.5-T and 3-T pCASL in detecting similar events in a particular patient. Third, continuous EEG monitoring could not be used in the present study, as with many local hospitals in Japan.[
CONCLUSION
Despite the need for further studies with more sophisticated methods, such as the combined use of continuous EEG monitoring, 1.5-T PASL with dual PLDs of 1.5 s and 2.0 s could show the hemodynamics of ictal hyperperfusion in patients with RIS and LPD. However, ictal ASL hyperperfusion could not be visualized in patients with extremely low amplitude RID or RDA of frequencies <2.5 Hz.
Declaration of patient consent
The authors certify that they have obtained all appropriate patient consent.
Financial support and sponsorship
This work was supported by a Grant-in-Aid for Scientific Research from the Japan Society for the Promotion of Science (JSPS) (JP21K17456 to T.S.).
Conflicts of interest
There are no conflicts of interest.
Acknowledgments
We thank Takashi Nakakogawa and Yasunobu Yoshitake as well as their colleagues at Harasanshin Hospital for supporting our study. We thank Editage for editing the draft of this manuscript.
References
1. Akiyama T, Morioka T, Shimogawa T, Haga S, Sayama T, Kanazawa Y. Arterial spin-labeling magnetic resonance imaging with dual post-labeling delay in internal carotid artery steno-occlusion: Validation with digital subtraction angiography. J Stroke Cerebrovasc Dis. 2016. 25: 2099-108
2. Alsop DC, Detre JA, Golay X, Günther M, Hendrikse J, Hernandez-Garcia L. Recommended implementation of arterial spin-labeled perfusion MRI for clinical applications: A consensus of the ISMRM perfusion study group and the European consortium for ASL in dementia. Magn Reson Med. 2015. 73: 102-16
3. Bambach S, Smith M, Morris PP, Campeau NG, Ho ML. Arterial spin labeling applications in pediatric and adult neurologic disorders. J Magn Reson Imaging. 2022. 55: 698-719
4. DeLorenzo RJ, Waterhouse EJ, Towne AR, Boggs JG, Ko D, Delorenzo GA. Persistent nonconvulsive status epilepticus after control of convulsive status epilepticus. Epilepsia. 1998. 39: 833-40
5. Dolui S, Vidorreta M, Wang Z, Nasrallah IM, Alavi A, Wolk DA. Comparison of PASL, PCASL, and background suppressed 3D PCASL in mild cognitive impairment. Human Brain Mapp. 2017. 38: 5260-73
6. Funakoshi Y, Shono T, Kurogi A, Kono S. Osteosarcoma of the temporal bone occurring 40 years after radiotherapy: A technical case report. Surg Neurol Int. 2021. 12: 152
7. Haga S, Morioka T, Kameda K, Takahara K, Amano T, Tomohara S. Subtraction of arterial spin-labeling magnetic resonance perfusion images acquired at dual post-labeling delay: Potential for evaluating cerebral hyperperfusion syndrome following carotid endarterectomy. J Clin Neurosci. 2019. 63: 77-83
8. Haga S, Morioka T, Shimogawa T, Akiyama T, Murao K, Kanazawa Y. Arterial spin labeling perfusion magnetic resonance image with dual postlabeling delay: A correlative study with acetazolamide loading (123)I-Iodoanphetamine single-photon emission computed tomography. J Stroke Cerebrovasc Dis. 2016. 25: 1-6
9. Hirsch LJ, LaRoche SM, Gaspard N, Gerard E, Svoronos A, Herman ST. American clinical neurophysiology society’s standardized critical care EEG terminology: 2012 version. J Clin Neurophysiol. 2013. 30: 1-27
10. Kanazawa Y, Arakawa S, Shimogawa T, Hagiwara N, Haga S, Morioka T. Arterial spin labeling magnetic resonance imaging for differentiating acute ischemic stroke from epileptic disorders. J Stroke Cerebrovasc Dis. 2019. 28: 1684-90
11. Kanazawa Y, Morioka T, Arakawa S, Furuta Y, Nakanishi A, Kitazono T. Nonconvulsive partial status epilepticus mimicking recurrent infarction revealed by diffusion-weighted and arterial spin labeling perfusion magnetic resonance images. J Stroke Cerebrovasc Dis. 2015. 24: 731-8
12. Leitinger M, Beniczky S, Rohracher A, Gardella E, Kalss G, Qerama E. Salzburg consensus criteria for non-convulsive status epilepticus-approach to clinical application. Epilepsy Behav. 2015. 49: 158-63
13. Murao K, Morioka T, Shimogawa T, Furuta Y, Haga S, Sakata A. Various pathophysiological states of acute symptomatic seizures immediately after ischemic stroke, namely “onset seizures”, shown by complementary use of peri-ictal magnetic resonance imaging and electroencephalography. Neurol Clin Neurosci. 2017. 5: 169-77
14. Ohtomo S, Otsubo H, Arai H, Shimoda Y, Homma Y, Tominaga T. Hyperperfusion in the thalamus on arterial spin labeling indicates non-convulsive status epilepticus. Brain Commun. 2020. 3: fcaa223
15. Shimogawa T, Morioka T, Akiyama T, Haga S, Arakawa S, Sayama T. Sequential changes of arterial spin-labeling perfusion MR images with dual postlabeling delay following reconstructive surgery for giant internal carotid artery aneurysm. Surg Neurol Int. 2017. 8: 222
16. Shimogawa T, Morioka T, Sayama T, Haga S, Kanazawa Y, Murao K. The initial use of arterial spin labeling perfusion and diffusion-weighted magnetic resonance images in the diagnosis of nonconvulsive partial status epilepticus. Epilepsy Res. 2017. 129: 162-73
17. Shirozu N, Morioka T, Tokunaga S, Shimogawa T, Inoue D, Arihiro S. Comparison of pseudocontinuous arterial spin labeling perfusion MR images and time-of-flight MR angiography in the detection of periictal hyperperfusion. eNeurologicalSci. 2020. 19: 100233
18. Soldozy S, Galindo J, Snyder H, Ali Y, Norat P, Yağmurlu K. Clinical utility of arterial spin labeling imaging in disorders of the nervous system. Neurosurg Focus. 2019. 47: E5
19. Takahara K, Morioka T, Shimogawa T, Haga S, Kameda K, Arihiro S. Hemodynamic state of periictal hyperperfusion revealed by arterial spin-labeling perfusion MR images with dual postlabeling delay. eNeurologicalSci. 2018. 12: 5-18
20. Tokunaga S, Morioka T, Shirozu N, Tsurusaki Y, Arihiro S, Shimogawa T. Arterial spin-labeling perfusion MR images with dual postlabeling delay reveals hemodynamic changes in dural arteriovenous fistulas following endovascular surgery. Interdiscip Neurosurg. 2020. 21: 100733
21. Wakisaka K, Morioka T, Shimogawa T, Murao K, Kanazawa Y, Hagiwara N. Epileptic ictal hyperperfusion on arterial spin labeling perfusion and diffusion-weighted magnetic resonance images in posterior reversible encephalopathy syndrome. J Stroke Cerebrovasc Dis. 2016. 25: 228-37