- Department of Neurosurgery, Waikato District Health Board, Hamilton, New Zealand,
- Department of Neurosurgery, Westmead Hospital, Sydney, Australia.
Correspondence Address:
Samuel Hall
Department of Neurosurgery, Waikato District Health Board, Hamilton, New Zealand,
DOI:10.25259/SNI_366_2019
Copyright: © 2019 Surgical Neurology International This is an open-access article distributed under the terms of the Creative Commons Attribution-Non Commercial-Share Alike 4.0 License, which allows others to remix, tweak, and build upon the work non-commercially, as long as the author is credited and the new creations are licensed under the identical terms.How to cite this article: Samuel Hall, Yee-Chiung (Peter) Gan. Anatomical localization of the transverse-sigmoid sinus junction: Comparison of existing techniques. 27-Sep-2019;10:186
How to cite this URL: Samuel Hall, Yee-Chiung (Peter) Gan. Anatomical localization of the transverse-sigmoid sinus junction: Comparison of existing techniques. 27-Sep-2019;10:186. Available from: https://surgicalneurologyint.com/surgicalint-articles/9678/
Date of Submission
23-Aug-2019
Date of Acceptance
04-Sep-2019
Date of Web Publication
27-Sep-2019
Abstract
Background: Anatomical localization remains integral to neurosurgery, particularly in the posterior fossa where neuronavigation is less reliable. There have been many attempts to define the location of the transverse- sigmoid sinus junction (TSSJ) using anatomical landmarks, to aid in the placement of the “strategic burr hole” during a retrosigmoid approach. There is a paucity of research allowing direct comparison of such techniques.
Methods: Using high-resolution contrast-enhanced cranial computed tomography images, we constructed three-dimensional virtual cranial models. Fifty models (100 sides) were created from a retrospective sample of images performed in a New Zealand population. Ten methods of anatomical localization were applied to each model allowing qualitative and quantitative comparisons. The “key point” was defined as the point on the outer surface of the skull that directly overlaid the junction of the posterior fossa dura, transverse sinus (TS), and sigmoid sinus (SS). The proximity of each method to this “key point” was compared quantitatively, in addition to other descriptive observations. TSSJ localization methods analyzed included: (1) asterion; (2) emissary foramen; (3) Lang and Samii; (4) Day; (5) Rhoton; (6) Avci; (7) Ribas; (8) Tubbs; (9) Li; and (10) Teranishi.
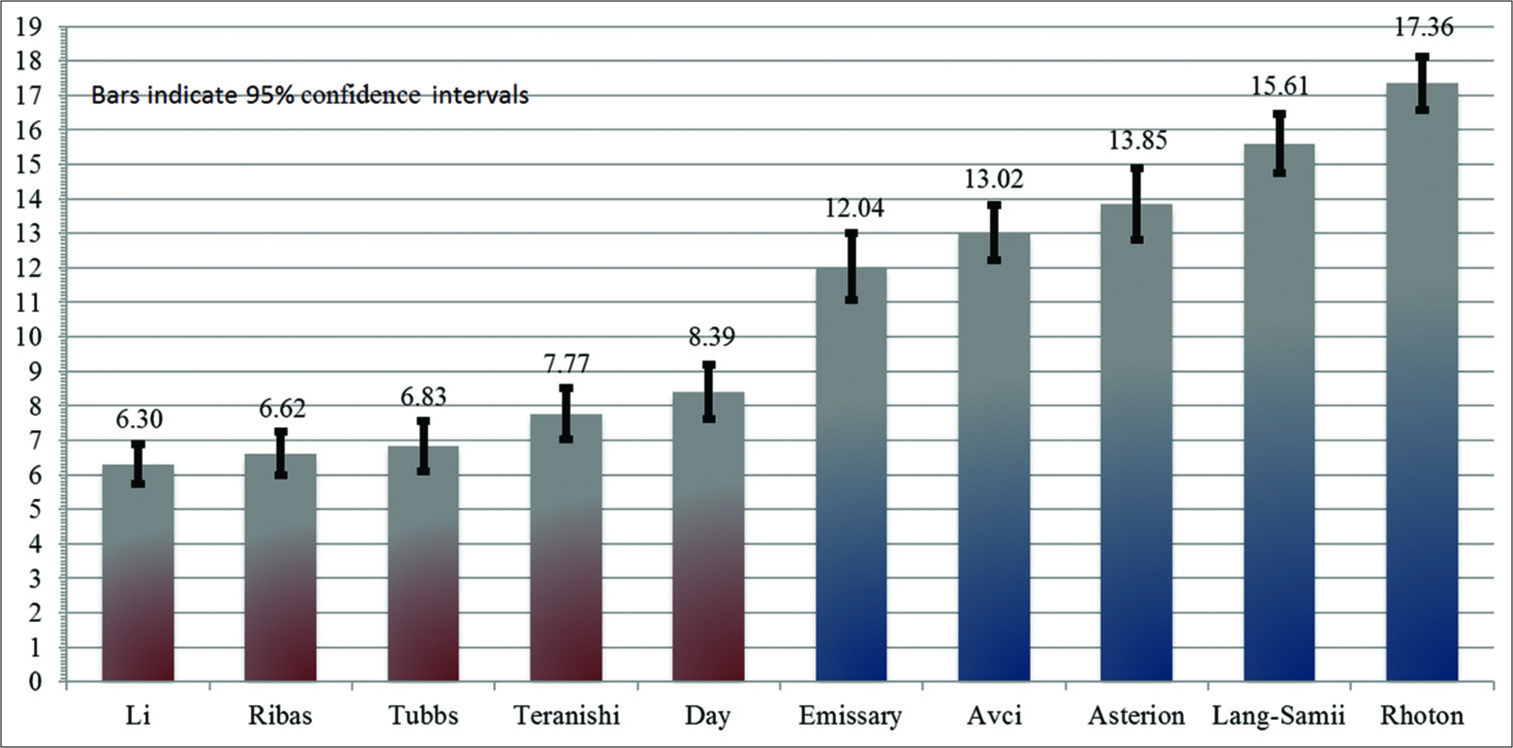
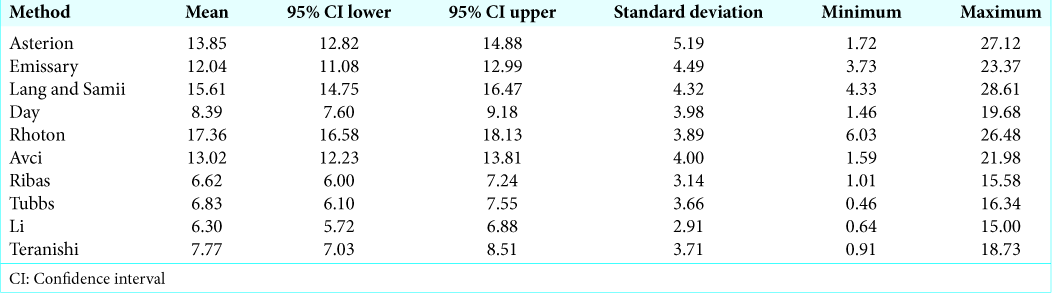
Results: Mean distance to the “key point” showed two tiers of accuracy, those 10 mm: Li (6.3 mm), Ribas (6.6 mm), Tubbs (6.8 mm), Teranishi (7.8 mm), Day (8.4 mm), emissary foramen (12.0 mm), Avci (13.0 mm), asterion (13.9 mm), Lang and Samii (15.6 mm), and Rhoton (17.4 mm). The asterion would most frequently overlie the TS (63%) and was often supratentorial (14%).
Conclusion: Each method has a unique profile of dura or sinus exposure. There are significant differences in the accuracy of localization of the TSSJ among anatomical localization methods.
Keywords: Anatomy, Computed tomography, Retrosigmoid craniotomy, Sigmoid sinus, Skull base, Transverse sinus
INTRODUCTION
Various anatomical methods have been described to aid in localization of the transverse- sigmoid junction, and the optimal site of initial burr hole placement in a retrosigmoid craniotomy. Despite the need for such anatomical landmarks, there is no consensus as to which provides the most reliable method to identify the relevant anatomy. Knowledge and application of such craniometric points are particularly important in posterior fossa surgery where frameless stereotactic systems are known to be less reliable.[
The superolateral boundary of the retrosigmoid approach is limited by the inferomedial angle of the transverse- sigmoid sinus junction (TSSJ). Dural opening immediately adjacent to this angle allows improved surgical access to the lateral posterior fossa and reduces the requirement for brain retraction during surgery. Knowledge of the TSSJ location allows placement of a strategic burr hole at the “key point” for a retrosigmoid craniotomy – that which exposes the junction of posterior fossa dura (PFD) and the margins of the adjacent transverse sinus (TS) and sigmoid sinus (SS). Prompt and safe exposure of this point improves operative efficiency and minimizes the potential morbidity associated with unnecessary over-exposure of the venous sinuses or oversized bony defects.
Historically, the asterion has been considered to be a reliable external landmark of the TSSJ.[
Using computed tomography (CT)-based three-dimensional (3D) model human skulls allows a detailed assessment of bony anatomy in living subjects and allows repeated assessments using different localization techniques. This method allows direct comparison of techniques without the potential confounding influence of interindividual variability that may be encountered in destructive cadaver studies or surgical series.
METHODS
Population
All patients were recruited from Waikato Hospital Neurosurgical service, either at the time of discharge from an inpatient admission or during an outpatient clinic consultation. Patients were eligible for inclusion if they had previously undergone a contrast enhanced cranial CT, and met the following criteria:
Adults (>18 years of age at the time the CT was obtained) and able to provide consent Images available on the local picture archiving and communication system (PACS) server Images include the region of interest (entire skull including orbital rim, zygomatic arch, inion, and mastoid tip) Image resolution is of sufficient quality to allow 3D reconstruction Without pathology that would alter the relevant anatomical regions.
Inclusion in the study was voluntary, with formal written consent obtained before enrollment.
Power calculations
A normal distribution data model was assumed. Previous comparative data found the degree of accuracy of each method ranged from approximately 4 mm to 6 mm with a standard deviation of approximately 3.5 mm. Using this data, to detect a 2 mm difference between studies with P = 0.05, and a power of 80% would require 96 subjects. We thus planned to analyze 100 sides, which would require the CT data of 50 patients.
Creating the simulation skulls
Clinical images in the Waikato DHB were accessed from the local PACS using Philips IntelliSpace PACS Enterprise Version 4.4.532.14. The Philips add-on software Volume Vision allows volume rendering of the high-resolution CT data, and the creation of various 3D models, including skulls. This application was utilized to create the simulation skulls for each of the subjects. Within this application, the skulls could be moved, rolled, rotated, cropped, and enlarged. Points and lines could be marked on the surface of the skull. The spatial coordinates were available for each marked point. Each point was also precisely correlated with two-dimensional data.
Data collection
All data were collected retrospectively. Basic demographic and clinical data were obtained (age, sex, ethnicity, and indication for the CT). All recorded data were deidentified and an arbitrary code assigned to each patient file. The simulation skull was then created using the CT data from each deidentified subject.
Performing the measurements
Creating the “primary position”
The simulation skull was rolled into a standardized position for each patient, the “primary position.” The horizontal axis was defined first, using an approximation of both the Frankfurt horizontal plane (FHP) and the “zygomatic line.” The skull was then rotated such that the region of bone immediately inferolateral to the asterion was at the forefront and perpendicular to the viewing line-of-sight (such that a theoretical burr hole would be perpendicular to the skull). This position shows the skull in a position representative of the surgical perspective, with the orthogonal axes (anteroposterior and vertical) of the skull concordant with the viewing perspective.
Defining the TSSJ
The TSSJ was defined using the technique described by Teranishi et al.[
Recording landmarks
The digastric point, asterion, and emissary foramen were then marked and recorded. The following techniques were then applied to the skull using a combination of point-to- point curved lines, and 3D straight lines: Lang and Samii;[
Some techniques defined the location of the edge of a planned burr hole, rather than the center. Such techniques were applied using an appropriate adjustment assuming a 12 mm diameter burr hole allowing standardization of measurement. Where the original technique included subjectivity, the applied technique was defined precisely to improve reproducibility. A summary of the original techniques and methods of application are presented in
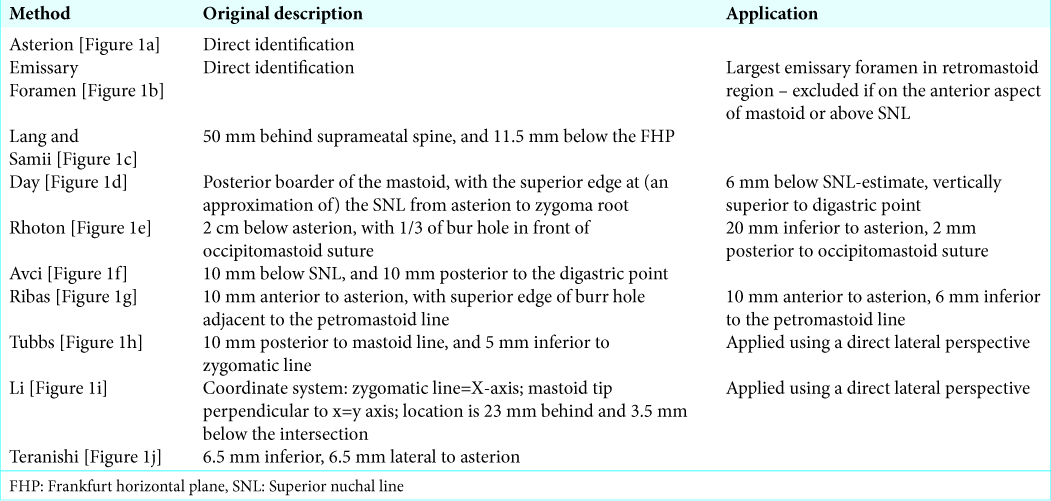
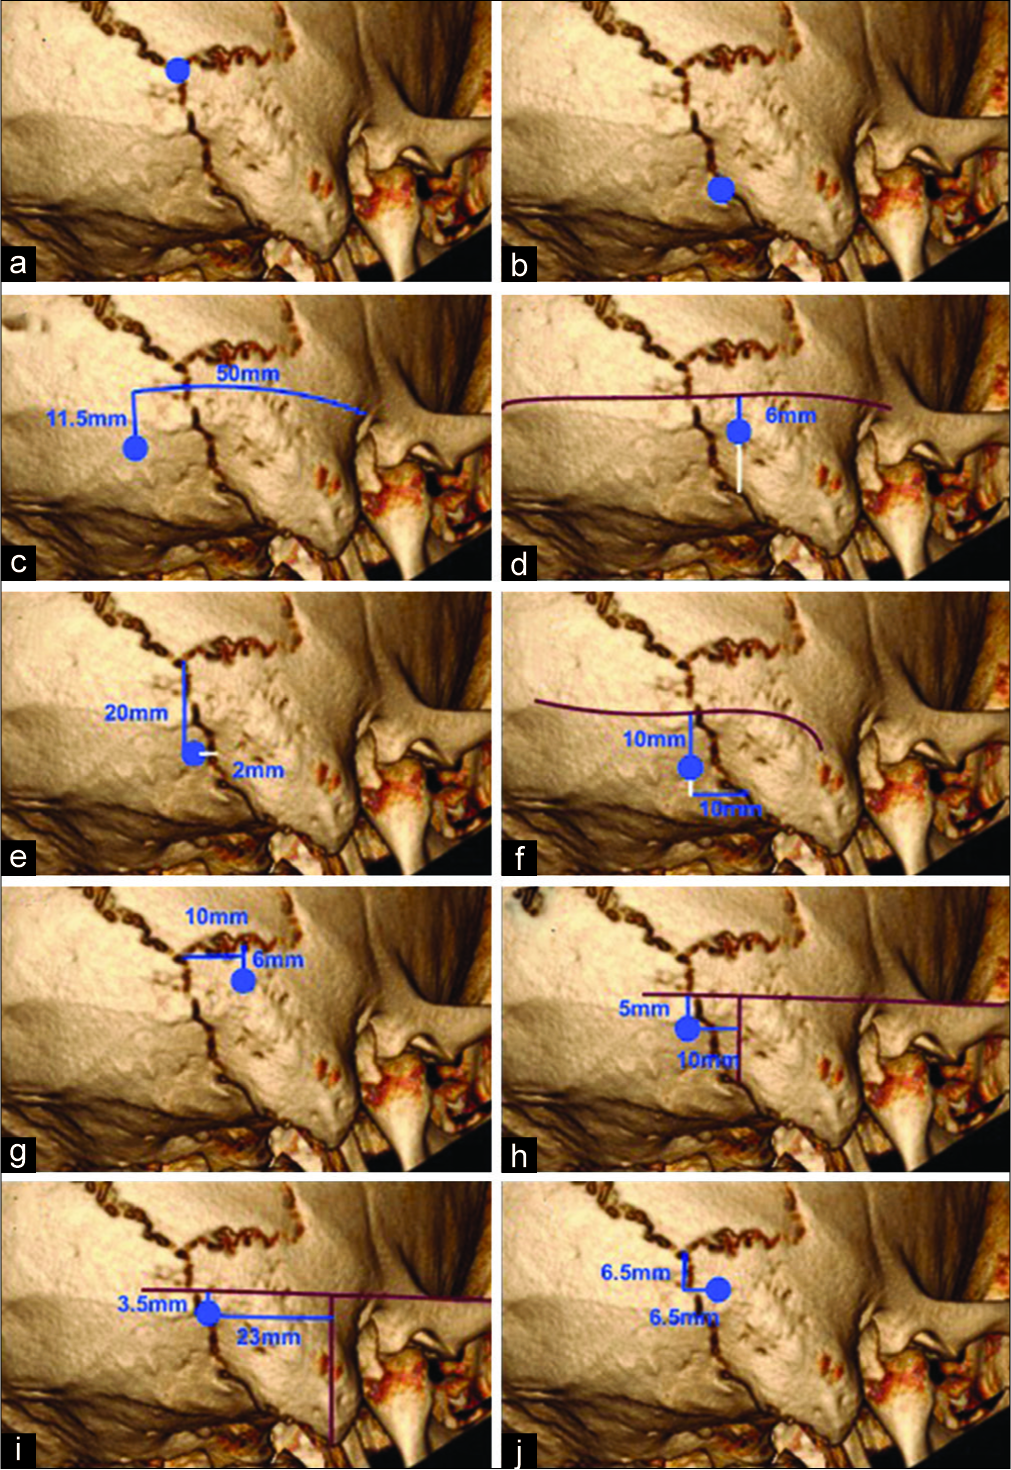
Figure 1:
Summary of techniques. For descriptions
Distance measurements and analysis
The distance between two points A (x1, y1, and z1) and B (x2, y2, and z2) in 3D space is provided by the following formula: AB = √((x2−x1)2+(y2−y1)2+(z2−z1)2). Using this formula, the distance in 3D space between each test point and the “key-point” was provided and recorded.
All data was processed in SPSS version 20. Primary outcome data were presented as an average distance from the “key- point” including 95% confidence intervals. Significance testing was performed using a two-sided Student’s t-test. Each technique application was assessed qualitatively for each side, categorizing the corresponding intracranial relation as follows: PFD, TS, SS, or “key-point.” Those directly overlying the junction of PFD with the TS or SS were categorized as TS-PFD, or SS-PFD, respectively. When the method localized superior to the TS or anterior to the SS, they were categorized as Nil-S and Nil-A, respectively. Localization of the outer margin of the venous sinuses was considered as either Nil-S or Nil-A. This qualitative data was tabulated and presented graphically.
RESULTS AND DISCUSSION
Demographics
A total of 50 subjects were enrolled, with CT imaging from October 2017 to November 2018. Gender profile was 26 males and 24 females. Age ranged from 26 to 85 years, with both mean and median age of 65 years. Ethnicity was as follows: New Zealand European/Pakeha (72%), Maori (12%), Chinese (8%), Samoan (4%), and Other (4%).
Distance to key point
To increasing mean distance (mm) from the “key-point,” each technique performed as follows: Li (6.30), Ribas (6.62), Tubbs (6.83), Teranishi (7.77), Day (8.39), Emissary (12.04), Avci (13.02), Asterion (13.85), Lang and Samii (15.61), and Rhoton (17.36);
Localization profile
Qualitative results of each technique are presented graphically [
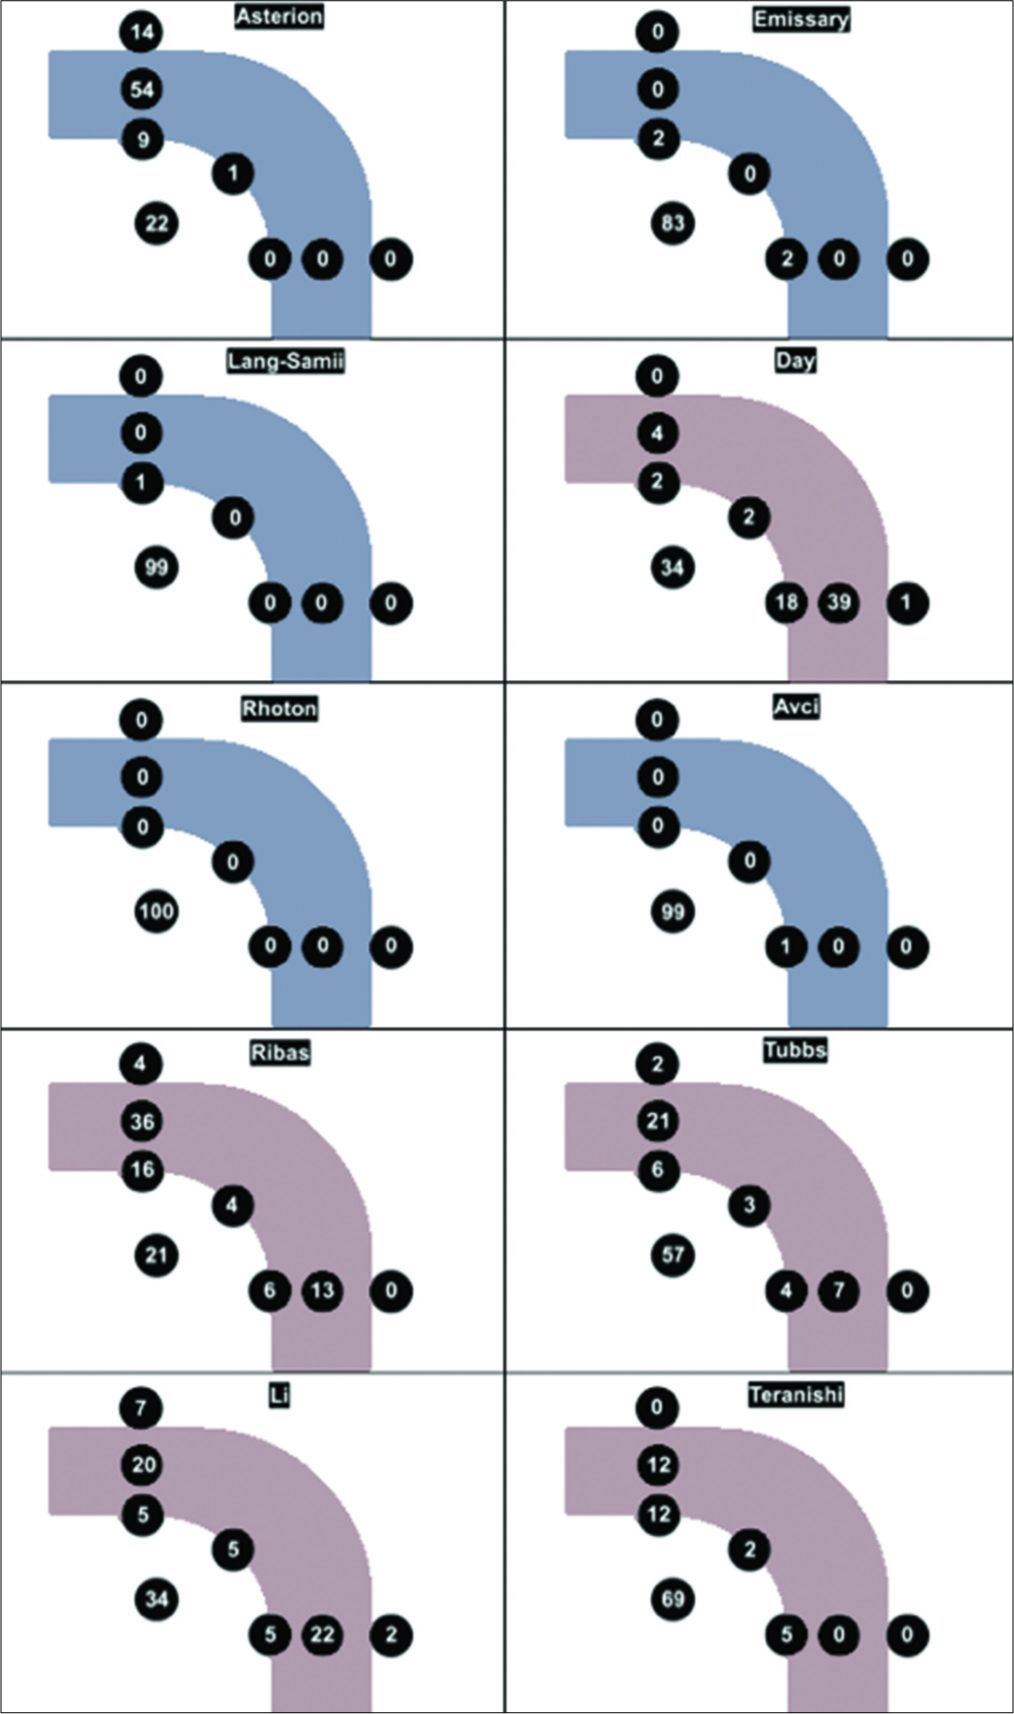
Figure 2:
Localization profile results. Graphical depiction of a right sided transverse-sigmoid sinus junction. Tally of results, qualitatively characterised as one of the following: posterior fossa dura, transverse sinus, sigmoid sinus, key-point, superior to transverse, anterior to sigmoid, and junctional.
Asterion
Although historically considered to be the external landmark of the TSSJ, our results would indicate that the asterion is a better indicator of the location of the lateral TS. The asterion overlaid the TS in 63%, was never found over the SS, and was found to be supratentorial in 14% of sides. These findings are comparable to prior studies.[
Lang and Samii, Rhoton, Avci, and Emissary Foramen
The techniques of Lang and Samii, Rhoton, and Avci shared many characteristics. Each were relatively imprecise estimates of the TSSJ with a mean distance to “key-point” of 13–17 mm. Each was reliably found overlay PFD (99–100%). On no occasion did any of these methods directly overlay a venous sinus. The emissary foramen had a similar profile but was not consistently identifiable. These techniques could be utilized to comfortably avoid the venous sinuses.
Li, Ribas, Tubbs, Teranishi, and Day
The techniques of Li, Ribas, Tubbs, Teranishi, and Day were each found to be more accurate estimates of the TSSJ then each of the other five tested methods. These differences were each statistically significant, and the magnitude of the differences (4–11 mm), we believe to be clinically relevant. Although the techniques of Li, Ribas, and Tubbs were statistically superior to Teranishi and Day, the magnitude of this difference is in the order of 2 mm. When differentiating between these techniques, it is likely that this 2 mm difference is less clinically important than the variable profiles of anatomical localization.
The Ribas method identified a venous sinus on 75% of tested sides, typically the TS (52%), but was supratentorial in 4%. The Day method identified a venous sinus in 65%, typically the SS (57%), but was found to be anterior to the sigmoid on one occasion (1%). The Teranishi method usually identified PFD (88%), rarely exposed the SS (5%) and was never found external to the margins of the venous sinuses. The Li technique was highly accurate, with a fairly even distribution between the TS (25%) and SS (27%). This accuracy was offset by a relatively high rate of lying superior (7%) or anterior (2%) to the TS and SS, respectively, second only to the asterion in this respect.
Strengths and limitations
The patient population is believed to be representative of the New Zealand population. The study was designed to allow recruitment of a broadly representative sample of the population. The study population was limited to those who encounter the neurosurgical service for practical purposes, but also facilitated patient enrollment and participation. Although all patients had encountered the neurosurgical service, because patients with surgically altered anatomy would have been excluded, it is unlikely this choice of the patient population would significantly alter study validity. Indeed, study demographics were found to be remarkably consistent with New Zealand 2013 Census data:[
Our study did not specifically examine the impact of racial background on the primary objectives. One study has shown racial variation in the relative craniocaudal position of the TSSJ with the internal auditory meatus.[
The primary benefit of using simulation skulls was that repeated measurements could be performed on each test subject, facilitating direct comparison of multiple techniques, and negating the potential confounding influence of interindividual variability encountered with destructive cadaver or in vivo studies.
Despite the various techniques described, there is currently only one study which has provided a comparison of accuracy, where the authors found their technique to be superior to two comparators.[
The principal limitation of this study relates to translation of results to the clinical environment. The CT model allows precise application of the described techniques in a highly controlled simulated environment. There are several factors which may influence the results of a given technique when applied in vivo, particularly those which rely on palpable landmarks which are outside the surgical field. The FHP, the superior zygomatic line, and the “approximated superior nuchal line” all rely on surface estimations of underlying bony anatomy. Estimation of these lines is likely to be less reliable in a surgical setting due to soft tissue, surgical drapes, and patient positioning. This uncontrolled variable is expected to disproportionately affect the techniques of Lang and Samii, Tubbs, Li, and Day.
In contrast, the techniques of Rhoton, Avci, Ribas, and Teranishi rely exclusively on local bony anatomy that is visible within the surgical field, allowing a reasonably direct translation of the results to the clinical setting. Although these techniques encounter fewer variables, each is critically dependent on clear identification of suture lines in vivo, a recognized limitation of these techniques.[
CONCLUSION
The results do not indicate clear superiority of any one technique but do demonstrate clear qualitative and quantitative differences between methods. The methods of Li, Tubbs, and Day are each highly accurate but are possibly better suited to preincision planning given the unknown influence of soft tissue and surgical drapes intraoperatively. The techniques of Ribas and Teranishi are also highly accurate, exclusively utilizing local bony anatomy within the surgical exposure. It is for this reason that we propose the Ribas and Teranishi techniques to be the most suited to intraoperative application for placement of the initial burr hole in a retrosigmoid approach: Ribas with a tendency to expose the lateral TS, and Teranishi typically overlying PFD.
The results of this study should help surgeons plan their approach to the lateral posterior fossa, by allowing optimal anatomical calculation of initial burr hole location, or serving as an adjunct to neuronavigation technologies.
References
1. Avci E, Kocaogullar Y, Fossett D, Caputy A. Lateral posterior fossa venous sinus relationships to surface landmarks. Surg Neurol. 2003. 59: 392-7
2. Barnett GH, Miller DW, Weisenberger J. Frameless stereotaxy with scalp-applied fiducial markers for brain biopsy procedures: Experience in 218 cases. J Neurosurg. 1999. 91: 569-76
3. Dao Trong P, Beynon C, Unterberg A, Schneider T, Jesser J. Racial differences in the anatomy of the posterior fossa: Neurosurgical considerations. World Neurosurg. 2018. 117: e571-e574
4. Day JD, Kellogg JX, Tschabitscher M, Fukushima T. Surface and superficial surgical anatomy of the posterolateral cranial base: Significance for surgical planning and approach. Neurosurgery. 1996. 38: 1079-83
5. Day JD, Tschabitscher M. Anatomic position of the asterion. Neurosurgery. 1998. 42: 198-9
6. Lang J, Samii A. Retrosigmoidal approach to the posterior cranial fossa. An anatomical study. Acta Neurochir (Wien). 1991. 111: 147-53
7. Li RC, Li K, Qi L, Xu GF, Xie WF, Wang MD. A novel reference coordinate system to locate the inferomedial point of the transverse-sigmoid sinus junction. Acta Neurochir (Wien). 2014. 156: 2209-13
8. Rhoton AL. Surface and superficial surgical anatomy of the posterolateral cranial base: Significance for surgical planning and approach (comment). Neurosurgery. 1996. 38: 1083-4
9. Ribas GC, Rhoton AL, Cruz OR, Peace D. Suboccipital burr holes and craniectomies. Neurosurg Focus. 2005. 19: E1-
10. . Available from: http://www.stats.govt.nz [Last accessed on 2019 Mar 27].
11. Teranishi Y, Kohno M, Sora S, Sato H. Determination of the keyhole position in a lateral suboccipital retrosigmoid approach. Neurol Med Chir (Tokyo). 2014. 54: 261-6
12. Tubbs RS, Loukas M, Shoja MM, Bellew MP, Cohen-Gadol AA. Surface landmarks for the junction between the transverse and sigmoid sinuses: Application of the “strategic” burr hole for suboccipital craniotomy. Neurosurgery. 2009. 65: 37-41
13. Xia L, Zhang M, Qu Y, Ren M, Wang H, Zhang H. Localization of transverse-sigmoid sinus junction using preoperative 3D computed tomography: Application in retrosigmoid craniotomy. Neurosurg Rev. 2012. 35: 593-8