- Department of Neurosurgery, Yamagata University, Yamagata, Japan.
- Department of Diagnostic Radiology, Faculty of Medicine, Yamagata University, Yamagata, Japan.
Correspondence Address:
Yukihiko Sonoda, Department of Neurosurgery, Yamagata University, Yamagata, Japan.
DOI:10.25259/SNI_879_2022
Copyright: © 2022 Surgical Neurology International This is an open-access article distributed under the terms of the Creative Commons Attribution-Non Commercial-Share Alike 4.0 License, which allows others to remix, transform, and build upon the work non-commercially, as long as the author is credited and the new creations are licensed under the identical terms.How to cite this article: Miiko Ito1, Yuta Mitobe1, Toshitada Hiraka2, Masafumi Kanoto2, Yukihiko Sonoda1. Changes in vascular supply pattern associated with growth of nonfunctioning pituitary adenomas. 21-Oct-2022;13:481
How to cite this URL: Miiko Ito1, Yuta Mitobe1, Toshitada Hiraka2, Masafumi Kanoto2, Yukihiko Sonoda1. Changes in vascular supply pattern associated with growth of nonfunctioning pituitary adenomas. 21-Oct-2022;13:481. Available from: https://surgicalneurologyint.com/surgicalint-articles/11944/
Date of Submission
21-Sep-2022
Date of Acceptance
04-Oct-2022
Date of Web Publication
21-Oct-2022
Abstract
Background: The vascular supply to nonfunctioning pituitary adenomas (NFPAs) differs compared with that of the anterior lobe of the normal pituitary gland. In this study, we aimed to identify feeding arteries and flow dynamics using 3.0 T magnetic resonance imaging (MRI) in NFPAs.
Methods: We divided 77 cases of NFPA into three groups according to the time-intensity curve (TIC) pattern by dynamic MRI. We also investigated the presence of feeder arteries as a flow void signal on T2-weighted imaging (T2WI).
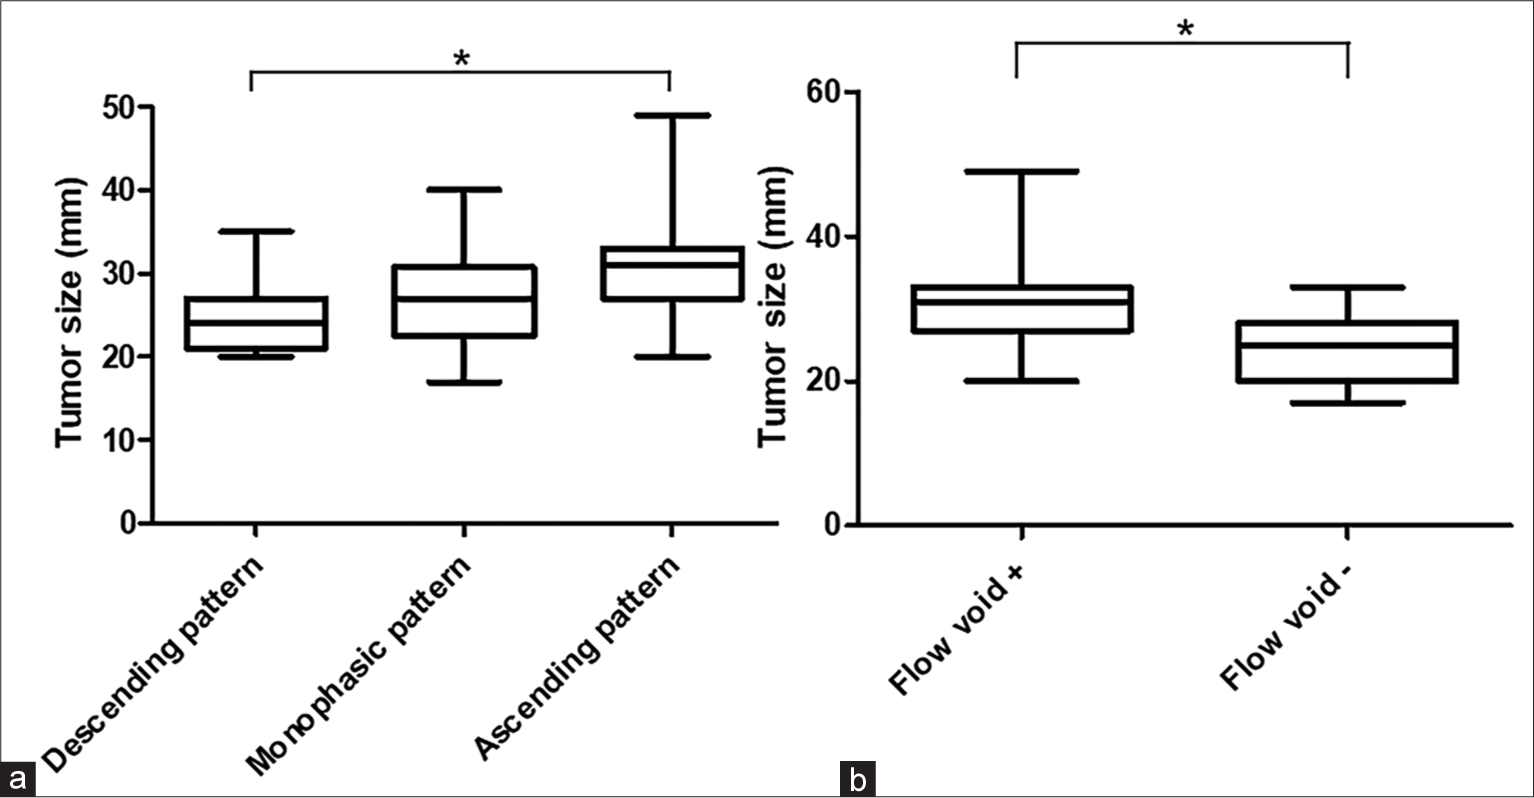
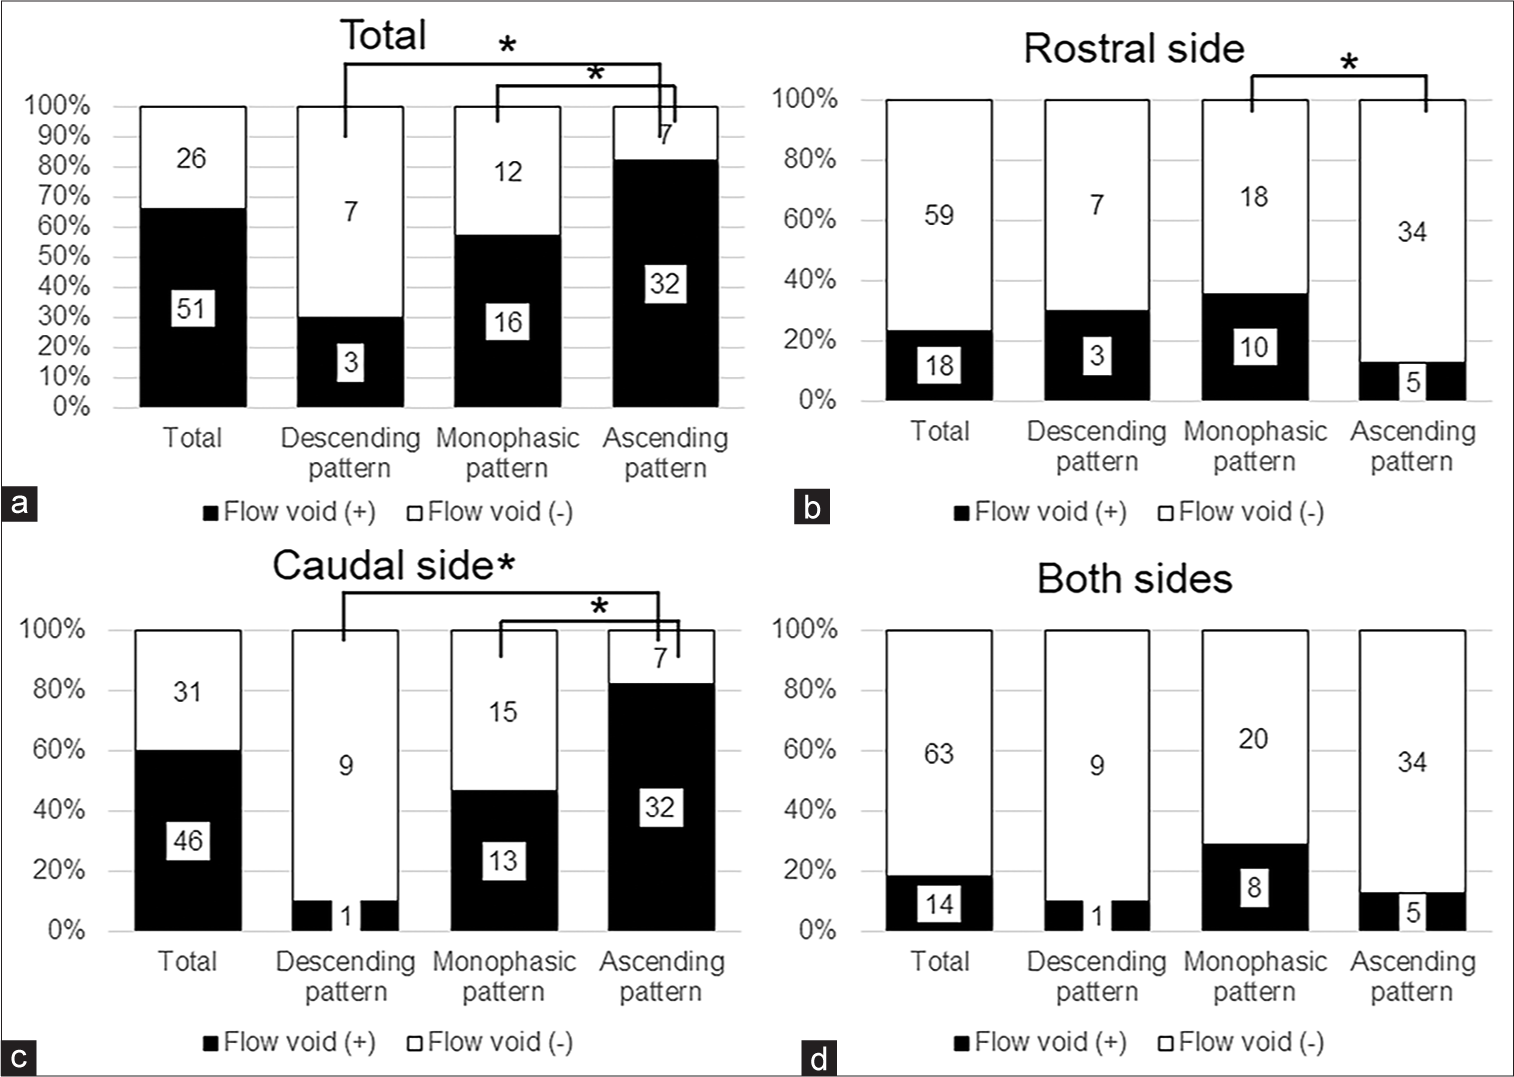
Results: According to the TIC, 39 cases demonstrated an ascending pattern, 10 cases demonstrated a descending pattern, and 28 cases demonstrated a monophasic pattern. Tumor size in the ascending group was larger compared with the descending group (P = 0.0036). Flow void signals were identified in 51 of 77 cases (66.2%) on T2WI. Tumor size was larger in tumors with a flow void signal compared with those without (P P = 0.032 and P = 0.003, respectively). Particularly on the caudal side, the difference between the ascending group and the monophasic and descending groups was remarkable (P = 0.0035 and P
Conclusion: We successfully evaluated the blood supply pattern by the TIC analysis and identified flow voids using 3.0 T MRI. Blood supply pattern was significantly associated with NFPA size. These results suggested that NFPA hemodynamics changes during tumor growth.
Keywords: Anastomose, Blood supply, Dynamic study, Nonfunctioning pituitary adenoma, Time-intensity curve
INTRODUCTION
The vascular supply of pituitary adenomas (PA) is not well understood. Previously, we reported three blood supply patterns (descending, monophasic, and ascending) in nonfunctioning pituitary adenomas (NFPAs) by the time-intensity curve (TIC) analysis using pituitary dynamic magnetic resonance imaging (MRI).[
Recently, some papers reported that PA feeding arteries are visible as flow void signals on MRI.[
MATERIALS AND METHODS
Patient selection
This retrospective study was conducted with the approval of the Ethics Committee of Yamagata University School of Medicine. Written informed consent was obtained from all patients before their participation in the study.
From July 2008 to December 2020, a total of 135 patients with NFPA underwent endoscopic transsphenoidal surgery (eTSS) at Yamagata University Hospital. All patients met the following inclusion criteria: (1) a diagnosis of NFPA; (2) no history of pituitary apoplexy; (3) undergoing a preoperative dynamic study; and (4) patients without large cystic formation in the tumor parenchyma on preoperative MRI. We analyzed a total of 77 patients with NFPA.
Radiological evaluation
All scans were performed using a 3.0 Tesla MRI unit (Discovery 750w, GE Healthcare, Milwaukee, Wisconsin) with a 24-channel head coil. The parameters for the plane MRI sequence are as follows: for sagittal T1-weighted TSE images, TR/TE of 400/12 ms, slice thickness of 3 mm without a gap, a matrix of 320 × 256, 180 × 180 mm FOV; for coronal T1-weighted TSE images, TR/TE of 437/12 ms, same as below; and for sagittal and coronal T2-weighted TSE images, TR/TE of 4000/80 ms, slice thickness of 3 mm without a gap, matrix of 320 × 224, 180 × 180 mm FOV. After precontrast sequence scanning, coronal dynamic contrast images were performed with rapid injection of a gadolinium-based contrast medium. Conventional coronal and sagittal postcontrast images were obtained with the following parameters: for dynamic coronal T1-weighted TSE images, TR/TE of 380/18 ms, three slices, dynamic scan in seven phases at 10, 26, 42, 57, 75, 100, and 130 s after injection, slice thickness of 3 mm with a gap of 0.5 mm, matrix of 288 × 160, 180 × 180 mm FOV; for sagittal postcontrast T1-weighted TSE image, TR/TE of 424/12 ms, slice thickness of 3 mm without a gap, matrix of 320 × 256, 180 × 180 mm FOV; and for coronal postcontrast T1-weighted TSE image, TR/TE of 516/12 ms, same as below.
As reported previously, we selected the section with the greatest longitudinal axis from among three slices of dynamic MRI scans and used it [
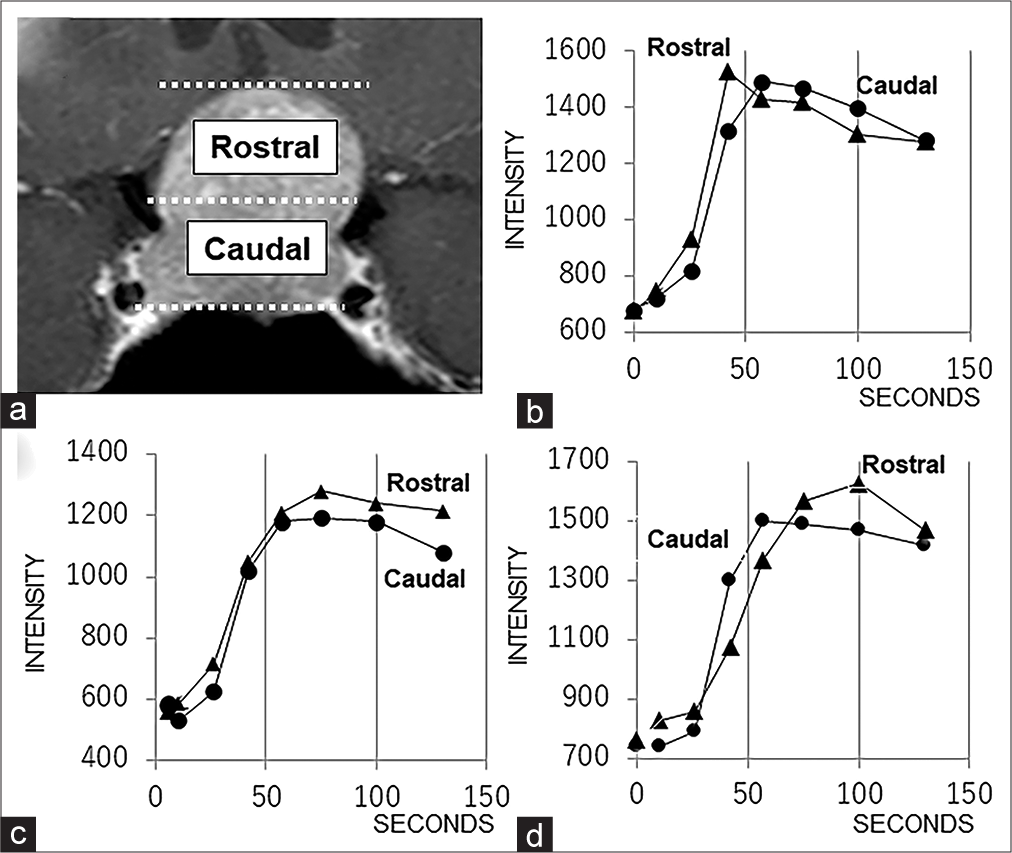
Figure 1:
(a) The two components (rostral and caudal) used to evaluate blood supply patterns by time-intensity curve analysis. (b) A representative graph showing the descending hemodynamic pattern. (c) A representative graph showing the monophasic hemodynamic pattern. (d) A representative graph showing the ascending hemodynamic pattern.
We identified blood vessels as flow void signals on T2-weighted imaging (T2WI) [
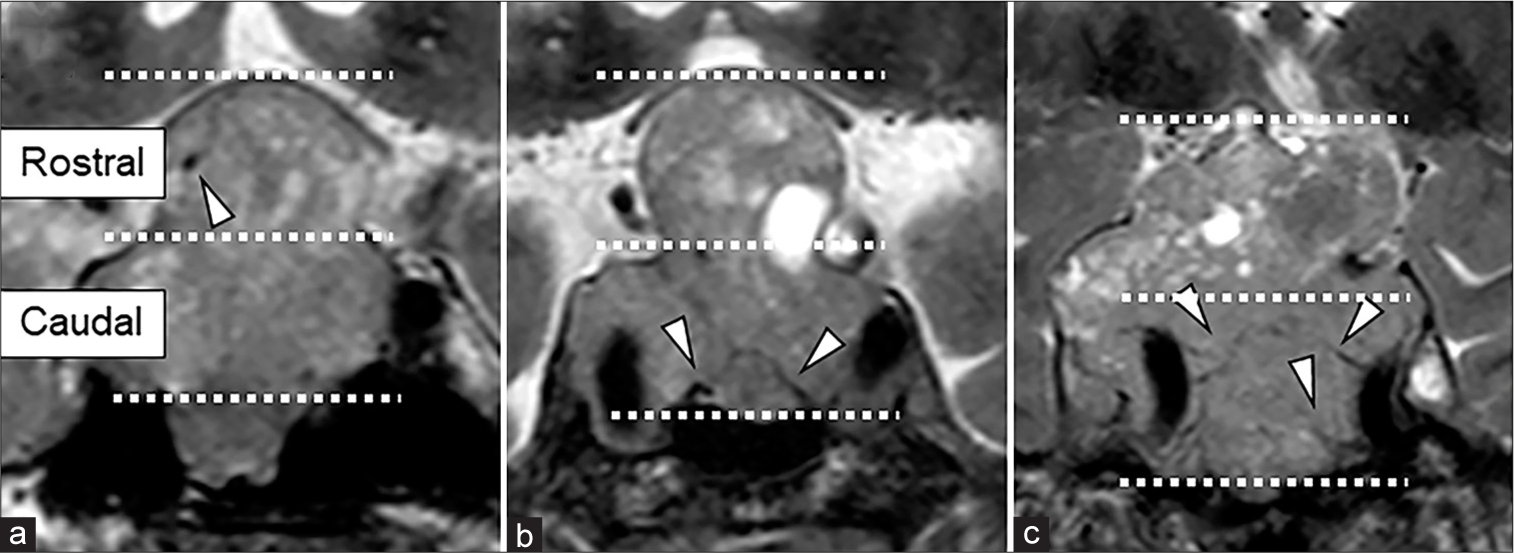
Figure 2:
Preoperative 3.0 T magnetic resonance imaging (MRI) of coronal sections. T2-weighted imaging shows the tumor flow voids (a) at the rostral side, (b) at the caudal side in the basal plane, and (c) at the caudal side branching from the internal carotid artery. Arrow heads indicate flow voids.
Each neurosurgeon or neuroradiologist made initial evaluations individually, and consensus among them resolved any disagreements regarding final conclusions.
Statistical analysis
Data were analyzed using statistical software (Prism; GraphPad Software, capsular artery [CA]). The Kruskal– Wallis test was used to determine differences in tumor size among the three blood supply patterns in NFPAs. The relationship between two variables was evaluated using the Mann–Whitney U-test and Fisher’s exact test. The significance level was set at P < 0.05.
RESULTS
The study included 77 patients (27 females and 50 males) with a median age of 63 years (range: 23–83 years). The median tumor size was 28 mm (range: 17–49 mm). According to the TIC classification, 10 cases demonstrated a descending pattern, 28 cases demonstrated a monophasic pattern, and 39 cases demonstrated an ascending pattern. There was a significant difference in tumor size among the three groups based on blood supply pattern (P = 0.004), [
DISCUSSION
The normal pituitary gland was perfused from the superior (SHA) and inferior hypophyseal artery (IHA) branching from the internal carotid artery (ICA).[
Compared to the normal pituitary gland, which is mainly perfused by the portal vein, the blood supply of the PA was considered arterial. In autopsy cases, 66% of microadenomas had a direct extraportal arterial supply.[
However, the normally invisible meningohypophyseal trunk (MHT) and CA were found angiographically in macroadenomas with suprasellar extension.[
Conversely, it has been difficult to detect feeding arteries in PAs using flow void signals on MRI.[
Previously, we reported three blood supply patterns in NFPAs by TIC analysis using dynamic MRI. Interestingly, these patterns depended on tumor size. Tumor size in the ascending pattern group was significantly larger compared with the descending pattern group.
Furthermore, the flow void signal was more frequently observed in the ascending pattern group. Particularly, the flow void signal location in the ascending pattern group was more frequently on the caudal side. Conversely, the descending pattern was negatively associated with presence of a flow void. Moreover, there was a significant correlation in the presence of a flow void signal at the rostral side between the monophasic and ascending pattern groups.
From these results, we hypothesized that the pattern of feeding arteries might change in NFPAs as the tumor grows [
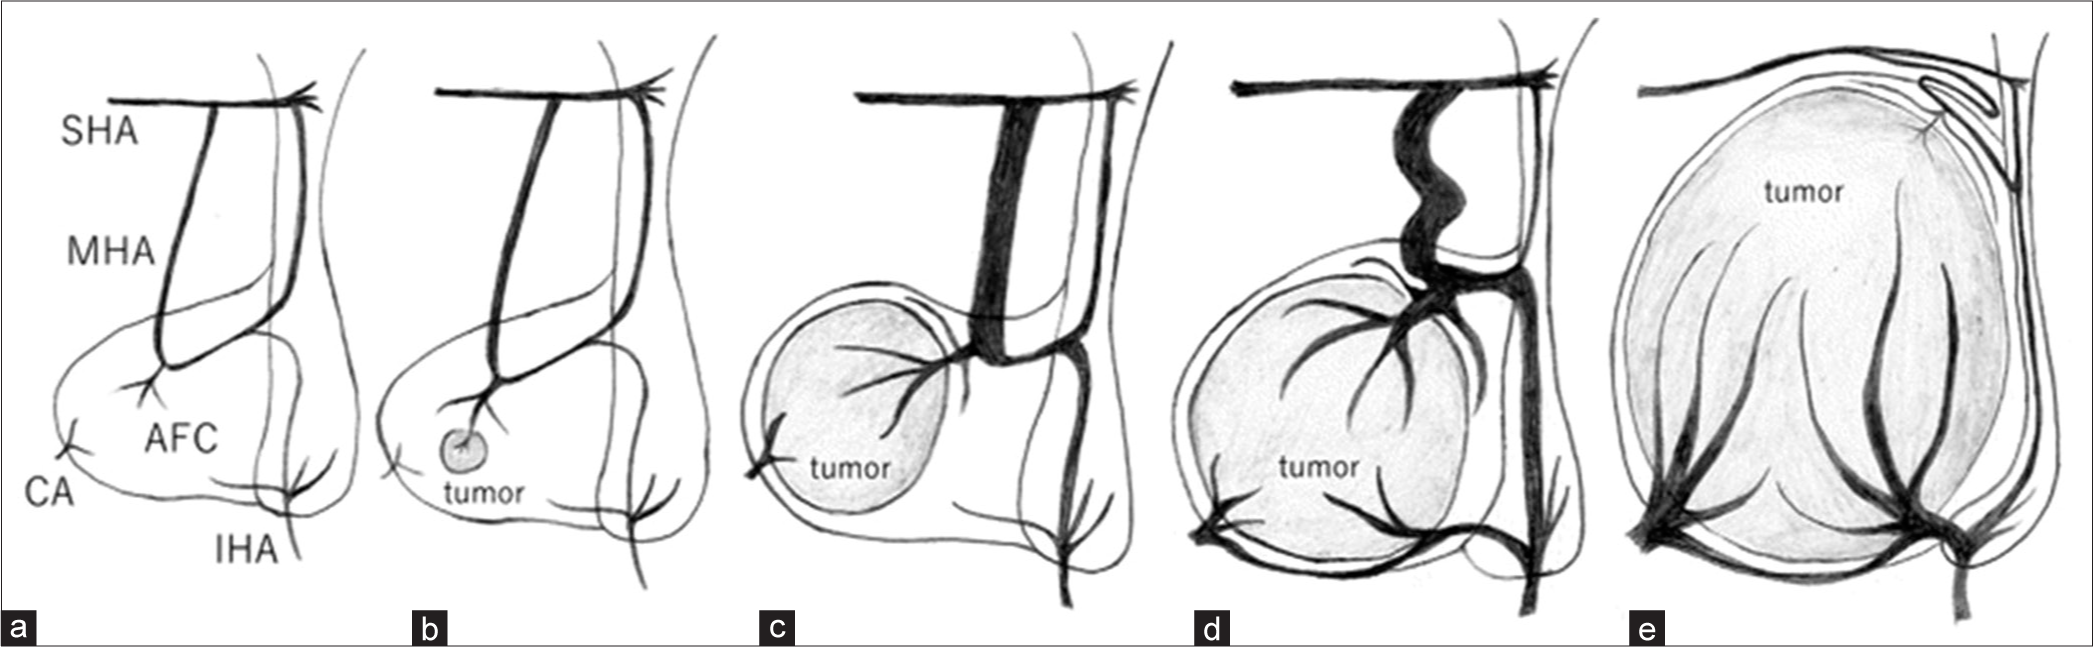
Figure 5:
Illustration of the change in vascular supply associated with tumor growth. (a) The normal anterior lobe of pituitary gland mainly receives its arterial blood supply from the middle hypophyseal artery (MHA) and anterior fibrous core (AFC), which branch from the superior hypophyseal artery (SHA) and inferior hypophyseal artery (IHA). These vessels are anastomosed to each other. (b) A microadenoma occurring in the anterior lobe that receives blood supply from the MHA and AFC. (c) An early-stage pituitary adenoma (PA) receiving blood supply from the MHA and AFC. (d) The MHA tortured and the inferior hypophyseal artery (IHA) grown through anastomosis as the tumor enlarged. (e) When the large tumor compressed the normal anterior lobe of the pituitary gland, the MHA collapsed, and the IHA via AFC and capsular artery (CA) from the lower surface mainly perfused the PA.
Our results also suggest that the blood supply to PAs is complex and consists of a dense network of blood vessels; therefore, no cases showed a complete ascending or descending pattern.
The present study has some limitations. First, since NFPAs are generally fairly large at diagnosis, there were relatively small numbers of NFPAs with a descending pattern. Second, flow void signals were not confirmed as feeding arteries by other methods, such as DSA. Therefore, the findings of T2WI hypointensity which seemed to be flow void signals might include fibrous components such as emissary veins and septum. Further investigation is required to determine whether changes in hemodynamics during tumor growth can be observed in patients with NFPAs.
CONCLUSION
We successfully evaluated the blood supply pattern by TIC analysis and identified flow voids using 3.0 T MRI. The blood supply pattern was significantly associated with NFPA size. This suggests that the hemodynamics of NFPAs changes during tumor growth. As many variations in anastomosis exist, the blood supply pattern depends on the growth process of the tumor and development of each artery. However, our results could be useful for surgical planning and predicting tumor shrinkage after eTSS.
Declaration of patient consent
Institutional Review Board (IRB) permission obtained for the study.
Financial support and sponsorship
JSPS KAKENHI (Grant Number 21K15820).
Conflicts of interest
There are no conflicts of interest.
Disclaimer
The views and opinions expressed in this article are those of the authors and do not necessarily reflect the official policy or position of the Journal or its management. The information contained in this article should not be considered to be medical advice; patients should consult their own physicians for advice as to their specific medical needs.
Acknowledgments
The authors are grateful to Ichiro Fujisawa for technical support and helpful comments on the manuscript. The authors thank Enago (https://www.enago.jp/) for the English language review.
References
1. Adams JH, Daniel PM, Prichard MM. Some effects of transection of the pituitary stalk. Br Med J. 1964. 26: 1619-25
2. Baker HL. The angiographic delineation of the sellar and parasellar masses. Radiology. 1972. 104: 67-78
3. Bonneville JF, Cattin F, Gorczyca W, Hardy J. Pitutary microadenomas: Early enhancement with dynamic CT-implications of arterial blood supply and potential importance. J Radiology. 1993. 187: 857-61
4. Gorczyca W, Hardy J. Arterial supply of the human anterior pituitary gland. Neurosurgery. 1987. 20: 369-78
5. Gorczyca W, Hardy J. Microadenomas of the human pituitary and their vascularization. Neurosurgery. 1988. 22: 1-6
6. Harris FS, Rhoton AL. Anatomy of the cavernous sinus: A microsurgical study. J Neurosurg. 1976. 45: 169-80
7. Inoue T, Rhoton AL, Theele D, Barry ME. Surgical approaches to the cavernous sinus: A microsurgical study. Neurosurgery. 1990. 26: 903-32
8. Ito M, Kuge A, Matsuda K, Sato S, Kayama T, Sonoda Y. The likelihood of remnant nonfunctioning pituitary adenomas shrinking is associated with the lesion’s blood supply pattern. World Neurosurg. 2017. 107: 137-41
9. Kurosaki M. Endonasal transsphenoidal surgery in department of neurosurgery, Tottori University. J Yonago Med Ass. 2017. 68: 1-8
10. Leclerco TA, Grisoli F. Arterial blood supply of the normal human pituitary gland. An anatomical study. J Neurosurg. 1983. 58: 678-81
11. Luschka H, editors. Der Hirnanhang und die Steisdrüse des Menschen. Berlin: Verlag Von Georg Reimer; 1860. p.
12. McConnell EM. The arterial blood supply of the human hypophysis cerebri. Anat Rec. 1953. 115: 175-203
13. Ogawa Y, Sato K, Matsumoto Y, Tominaga T. Evaluation of fine feeding system and angioarchitecture of giant pituitary adenoma--implications for establishment of surgical strategy. World Neurosurg. 2016. 85: 244-51
14. Okamoto K, Ito I, Furusawa T, Sakai K. Intratumoral flow void in pituitary adenomas. Am J Roentgenol. 1996. 167: 1070-1
15. Parkinson D. A surgical approach to the cavernous portion of the carotid artery: Anatomical studies and case report. J Neurosurg. 1965. 23: 474-83
16. Powell DF, Baker HL, Laws ER. The primary angiographic findings in pituitary adenomas. Radiology. 1974. 110: 589-95
17. Sheehan HL, Stanfield JP. The pathogenesis of post-partnum necrosis of the anterior lobe of the pituitary gland. Acta Endocr. 1961. 37: 479-510
18. Stanfield JP. The blood supply of the human pituitary gland. J Anat. 1960. 94: 257-73
19. Xuereb GP, Prichard MM, Daniel PM. The arterial supply and venous drainage of the human hypophysis cerebri. Q J Exp Physiol. 1954. 39: 199-21