- Department of Surgical Neurology, University of Chicago Medicine, Chicago, United States.
Correspondence Address:
Javad Hekmatpanah, Department of Surgical Neurology, University of Chicago Medicine, Chicago, United States.
DOI:10.25259/SNI_998_2023
Copyright: © 2024 Surgical Neurology International This is an open-access article distributed under the terms of the Creative Commons Attribution-Non Commercial-Share Alike 4.0 License, which allows others to remix, transform, and build upon the work non-commercially, as long as the author is credited and the new creations are licensed under the identical terms.How to cite this article: Javad Hekmatpanah. Correlation of cerebral microvascular circulation with vital signs in cerebral compression and the validity of three concepts: vasodilation, autoregulation, and terminal rise in arterial pressure. 22-Mar-2024;15:95
How to cite this URL: Javad Hekmatpanah. Correlation of cerebral microvascular circulation with vital signs in cerebral compression and the validity of three concepts: vasodilation, autoregulation, and terminal rise in arterial pressure. 22-Mar-2024;15:95. Available from: https://surgicalneurologyint.com/surgicalint-articles/12820/
Date of Submission
20-Dec-2023
Date of Acceptance
14-Feb-2024
Date of Web Publication
22-Mar-2024
Abstract
Background: Vasodilation, autoregulation, and rising arterial pressure are three common concepts in cerebral compression, believed to improve cerebral blood flow to maintain the brain’s nutrition. However, these concepts are unclear, unproven, and based on assumptions. This study aimed to correlate cerebral circulation with alterations of vital signs and to evaluate the above concepts based on physics and hemodynamics.
Methods: Without new animal experiments, a large amount of data: recording of vital signs, long movies of cerebral circulation, and numerous photos of histological examination and microvessels obstruction in cerebral compression in cats was studied, and only partial and preliminary results were reported in 1970. The experiments were supported by an NIH grant for head injury, done before the 1985 Institutional Animal Care and Use Committee requirement. The advent of digital technology facilitated digitizing and stepwise correlating them and evaluating the validity of the above concepts.
Results: As cerebral compression increased intracranial pressure (ICP), veins dilated, not arteries, and arterial microvessels obstructed, diminished, and stopped cerebral circulation. Simultaneously, vital signs deteriorated, and pupils became fixed and dilated. There was no evidence for what is believed as autoregulation.
Conclusion: In cerebral compression, rising ICP obstructs cerebral arterial microvessels while simultaneously deteriorating vital signs. There is no evidence for dilatation of the arteries; only veins dilate, best-called venodilation. There is no evidence of autoregulation; what occurs is a cerebral compartmental syndrome. The terminal rise of arterial pressure is the hemodynamic result of cerebral circulation cessation, overloading the aorta. None of the concepts benefit the brain’s nutrition.
Keywords: Autoregulation, Cerebral compression, Intracranial pressure, Vasodilation, Venodilation
INTRODUCTION
Vasodilation, autoregulation, and the terminal rise of intracranial pressure (ICP) are concepts commonly believed to improve cerebral circulation in cerebral compression. However, their concepts stem from assumptions and do not convey the actual dynamics of cerebral circulation in cerebral compression; their belief causes erroneous interpretations of clinical and laboratory findings. This study aimed to correlate cerebral-microvessels-circulation with the alteration of vital signs and pupils and to evaluate the above concepts based on hemodynamics and physics formulas.
MATERIALS AND METHODS
Without new animal experiments, a large amount of data: vital signs records, cerebral circulation movies, and numerous histology and microvessels’ obstruction photos in cerebral compression in cats were studied, of which only partial and preliminary results were reported in 1970. The experiments were supported by an NIH grant to study head injury, which was done more than a decade before the 1985 Institutional Animal Care and Use Committee requirement. The advent of digital technology facilitated digitizing, correlating the data, and evaluating the validity of the above concepts.
The experiments were done under general anesthesia, with intraperitoneal injections of Sodium Pentobarbital, 20 mg/kg. The cerebral compression was through gradual inflation of a small balloon, inserted in the epidural region through a small bur hole, in which an increment of 0.2 mL saline was injected every 5 min. ICP was measured through a similar small balloon inserted through a bur hole on the opposite side. Central arterial blood pressure (BP) was recorded through a polyethylene tube inserted in the aorta through the femoral artery. A bellow was applied around the chest to record respiration. The dilation of pupils was photographed, and their outlines were drawn. All were connected to a Beckman dynograph via strain gauges for recording, and electroencephalogram (EEG) electrode wires were attached to the skull.
In 15 animals, circulation of the cortical vessel was observed and recorded through another bur hole behind the one for the ICP recording, in which the dura was opened, and the arachnoid was covered with fitted sealed glass. Through this bur hole, cerebral circulation was observed and recorded using still and movie cameras with magnifications of up to ×100. Because of motion artifacts by pulsation and respiration, most recordings were done at ×25 magnification. At each conspicuous change in vital signs in an experiment, Evans Blue, India Ink, or Micro Barium was injected in vivo into the heart through the central catheter to evaluate the patency of cerebral arterial microvessels or to inject glutaraldehyde for fixation of tissues; each dye was used for one animal. At the end of the experiment, the animal died in a coma without discomfort.
RESULTS
As cerebral compression gradually increased and ICP rose, venules’ circulation slowed first, and veins dilated, followed by gradual narrowing and obstruction of arterial capillaries with final cessation of their circulation. Simultaneously, vital signs altered, starting with slowing and diminishing the amplitude of ipsilateral EEG, slowing respiration and pulse, dilating the ipsilateral pupil followed by the contralateral pupil, ending in the arrest of all vital signs; the alterations were compared with those of normal,
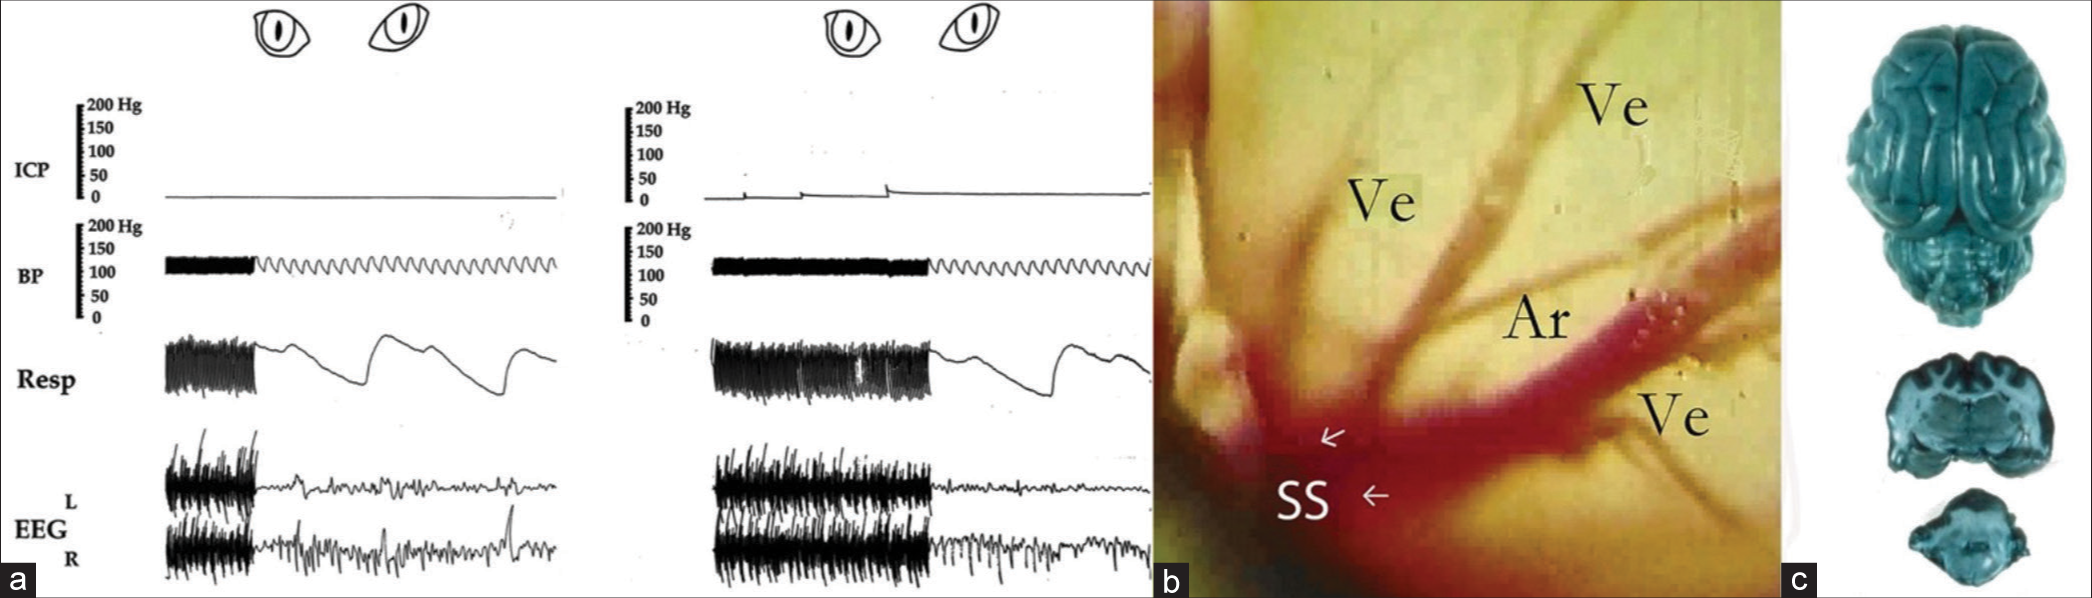
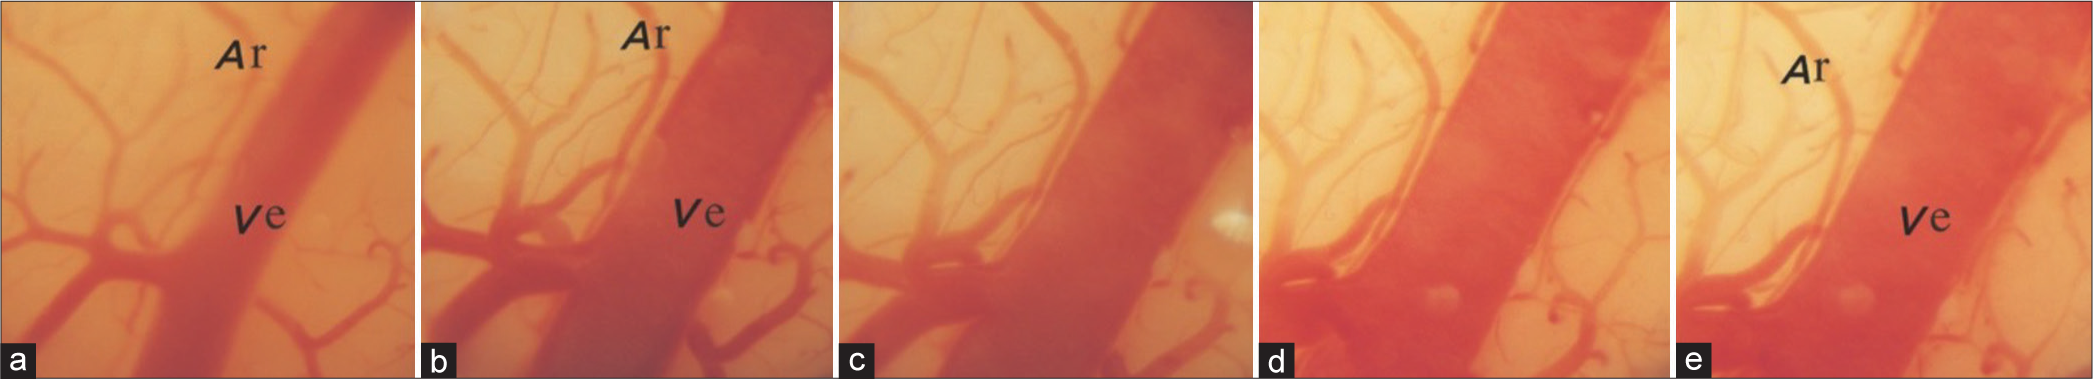
Figure 1:
(a-c) shows normal vital signs, a photo of the cerebral cortex, and a photo of the normal brain perfused with Evans Blue dye injected in vivo, used as controls. Note 10–20 mmHg rises in intracranial pressure after each injection of 0.2 mL saline in the compression balloon and partially falls after with no change in vital signs during the first three increments in photo a. Photo b is from a movie of the cerebral cortex through the microscope with 25 times magnification; note three veins (Ve) entering the sagittal sinus (SS), an artery (Ar) crossing, and the normal pink color of the cortex. The dark blue color of the brain in photo c represents infiltration of Evans Blue dye (0.2 mL/kg body weight) in open capillaries of a normal cat’s brain. Vital signs records are partly from this author’s preliminary publication with permission from the Journal of Neurosurgery.[
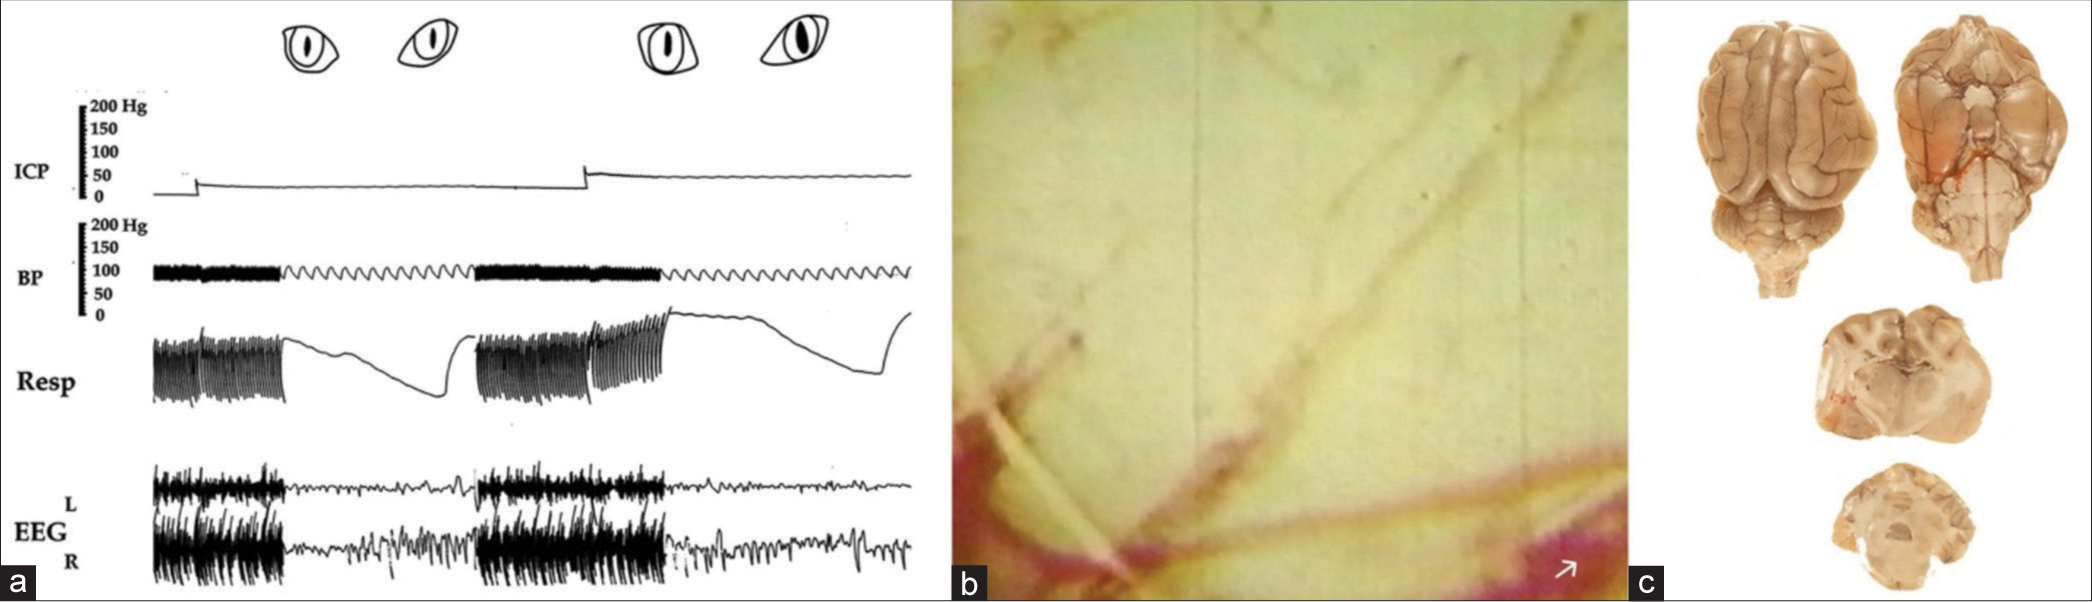
Figure 2:
(a) Slowing respiration and suppression of ipsilateral EEG as intracranial pressure approaches 25 mm Hg and dilating the ipsilateral pupil as it reaches 40 mm Hg. The slowness of circulation is manifested by the blurred appearance of individual red cells as they pass through. The pallor of the cortex in (b) and significantly diminished infiltration of Evans Blue dye in (c) represent obstruction of a large proportion of arterial microvessels. Note partial dilatation of the lower vein in which the flow is reversed and no dilatation of the artery. ICP: Intracranial pressure; BP: Blood pressure, Resp: Respiration, EEG: Electroencephalogram.
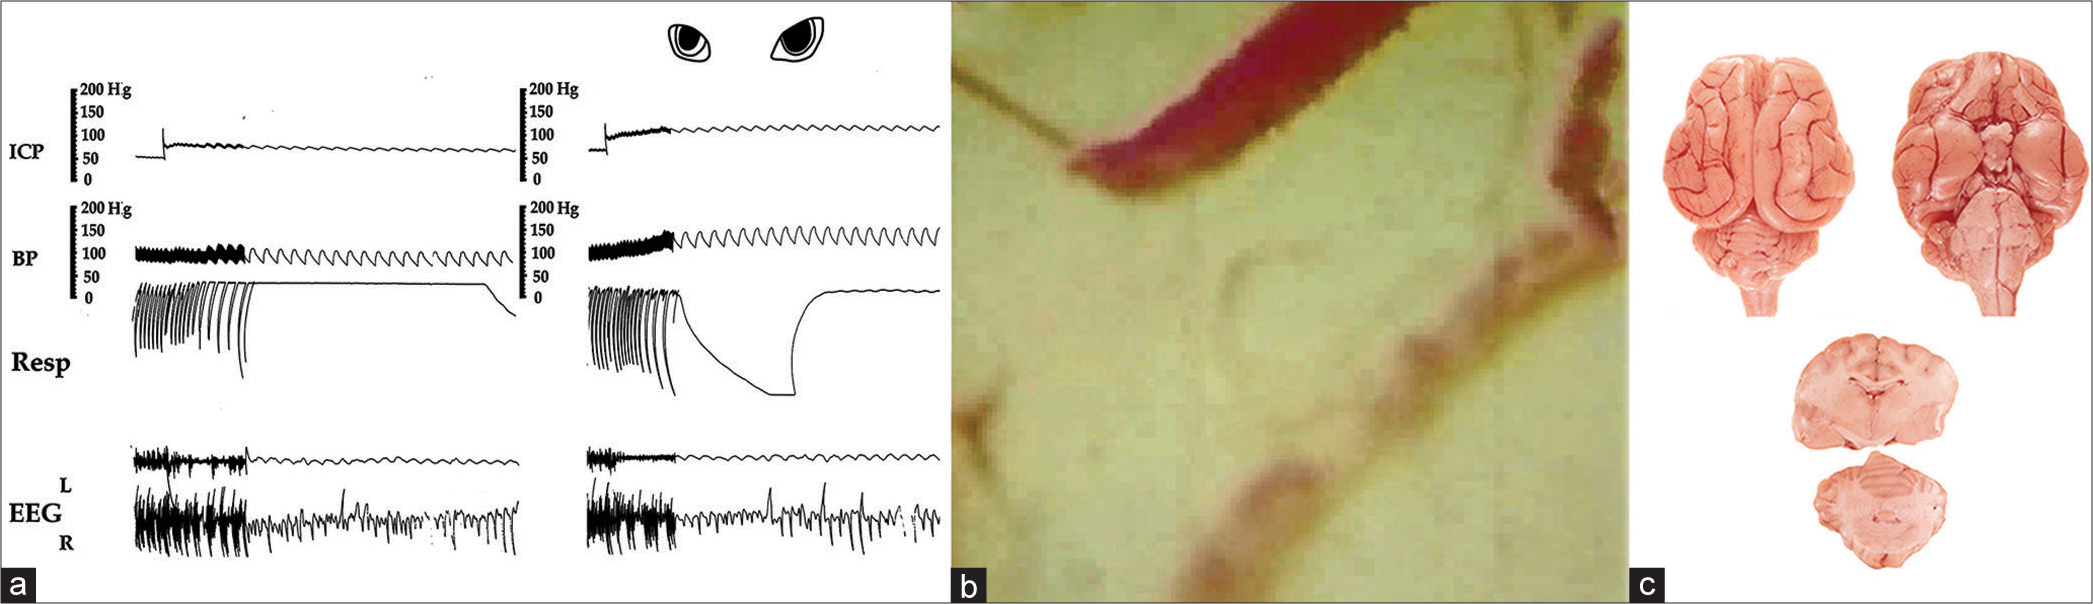
Figure 3:
(a) Marked slowing respiration with periodic Cheyne Stokes pattern, EEG with flattened amplitude on the ipsilateral side showing just pulse artifact and dilating both pupils when intracranial pressure approaches diastolic arterial pressure. Note also markedly dilated veins and slowed circulation manifested by separated red cells, some of which are adhered together, almost no circulation in the artery and pallor of the cortex, (b) and little infiltration of dye in the brain, (c), repressing obstruction of microvessels. ICP: Intracranial pressure; BP: Blood pressure, Resp: Respiration, EEG: Electroencephalogram.
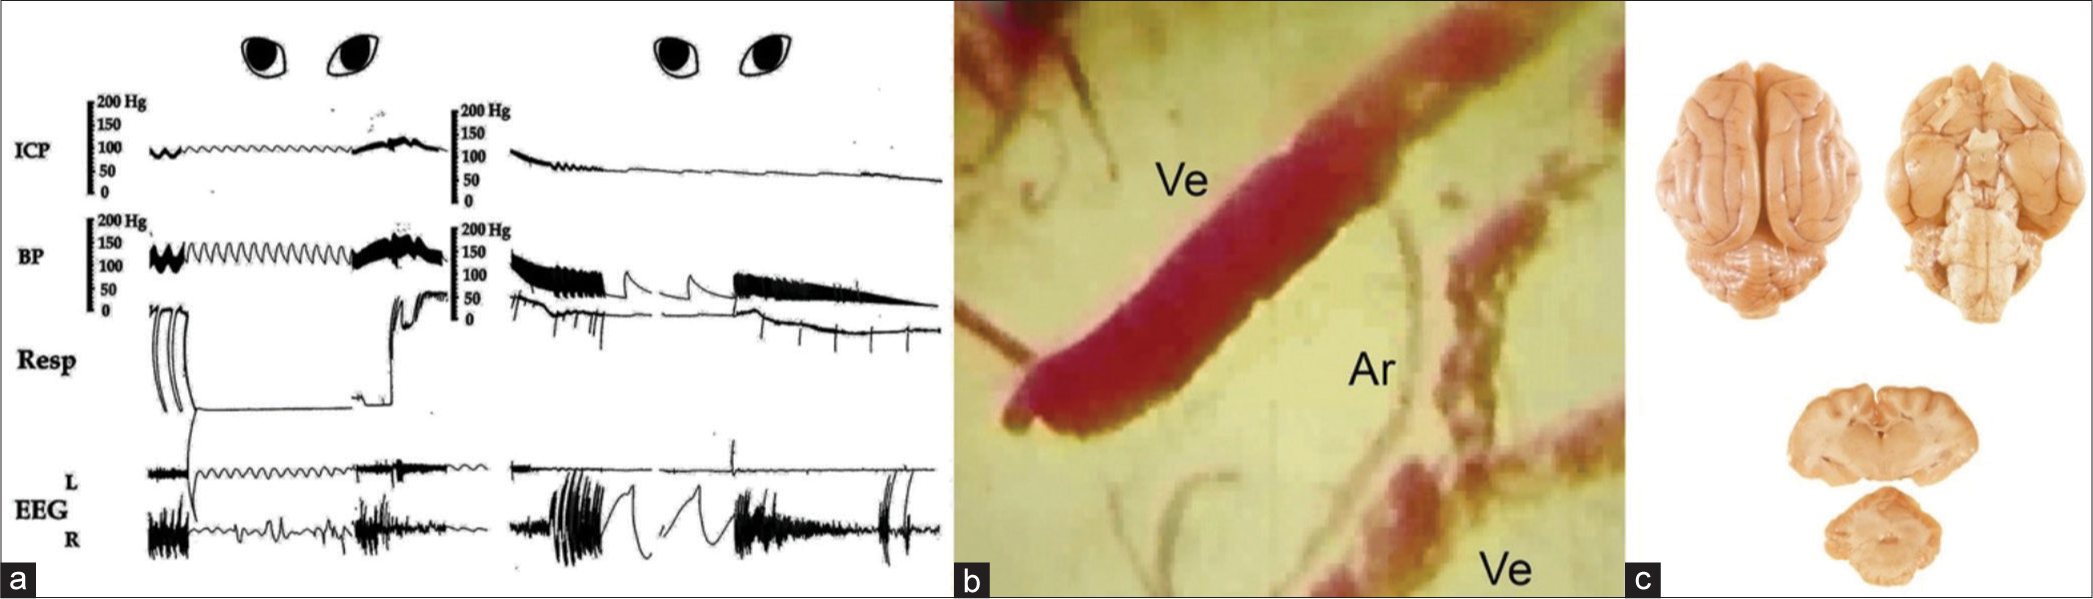
Figure 4:
The rapid rise of both blood pressure (BP) and intracranial pressure (ICP) followed by their simultaneous fall without balloon deflation. Markedly slowed respiration, slowed irregular pulse, flattened EEG on both sides showing mainly pulse artifacts, and dilated-fixed pupils, (a) The circulation is stopped, the cortex becomes pale, and veins become markedly dilated with no dilatation of the arteries, (b) There is no infiltration of the dye in the brain (c) indicating complete blockage of arterial microvessels and simultaneously dilated and fixed pupils., Note that at the end, when vital signs collapsed and BP declined to zero, the ICP also declined to around 25 mmHg. This occurred without the deflation of the balloon, which has an important clinical significance (see the explanation in the text). ICP: Intracranial pressure; BP: Blood pressure, Resp: Respiration, EEG: Electroencephalogram, Ve: Vein, Ar: Artery.
After each increment of 0.2 mL saline in the balloon, the ICP rose around ten mmHg and declined partially,
As cerebral compression and ICP increased, the output of veins to the SS was blocked, and veins dilated. In some veins, circulation reversed,
Simultaneously, the ipsilateral EEG slowed, and its amplitude declined when the ICP approached about 25 mmHg,
From there on, arterial capillaries obstructed rapidly. When ICP approached diastolic BP, marked slowness of respiration and pulse occurred with both pupils dilating; sometimes, respiration became in Cheyne Stoke form,
Finally, a sharp rise in both ICP and BP occurred simultaneously with the obstruction of all arterial microvessels and dilated fixed pupils,
The electron microscopy of the cerebral cortex revealed marked evidence of ischemic changes and perivascular swelling, as compared with normal
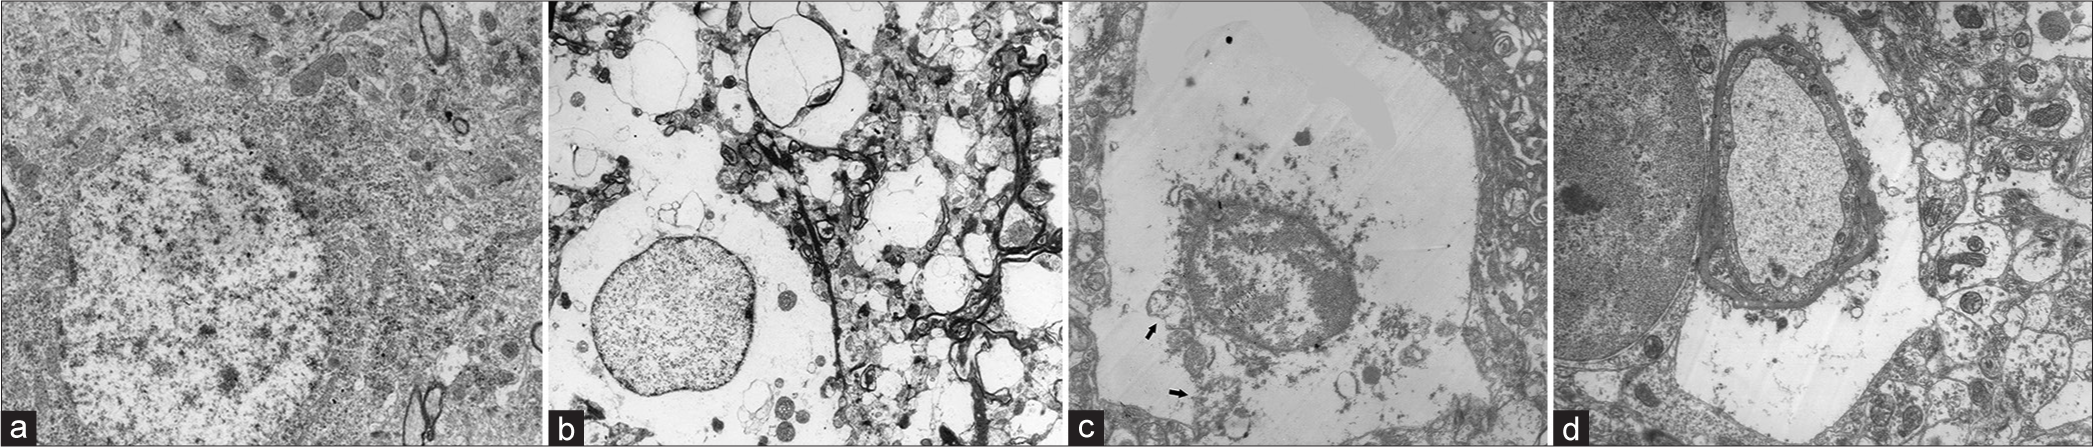
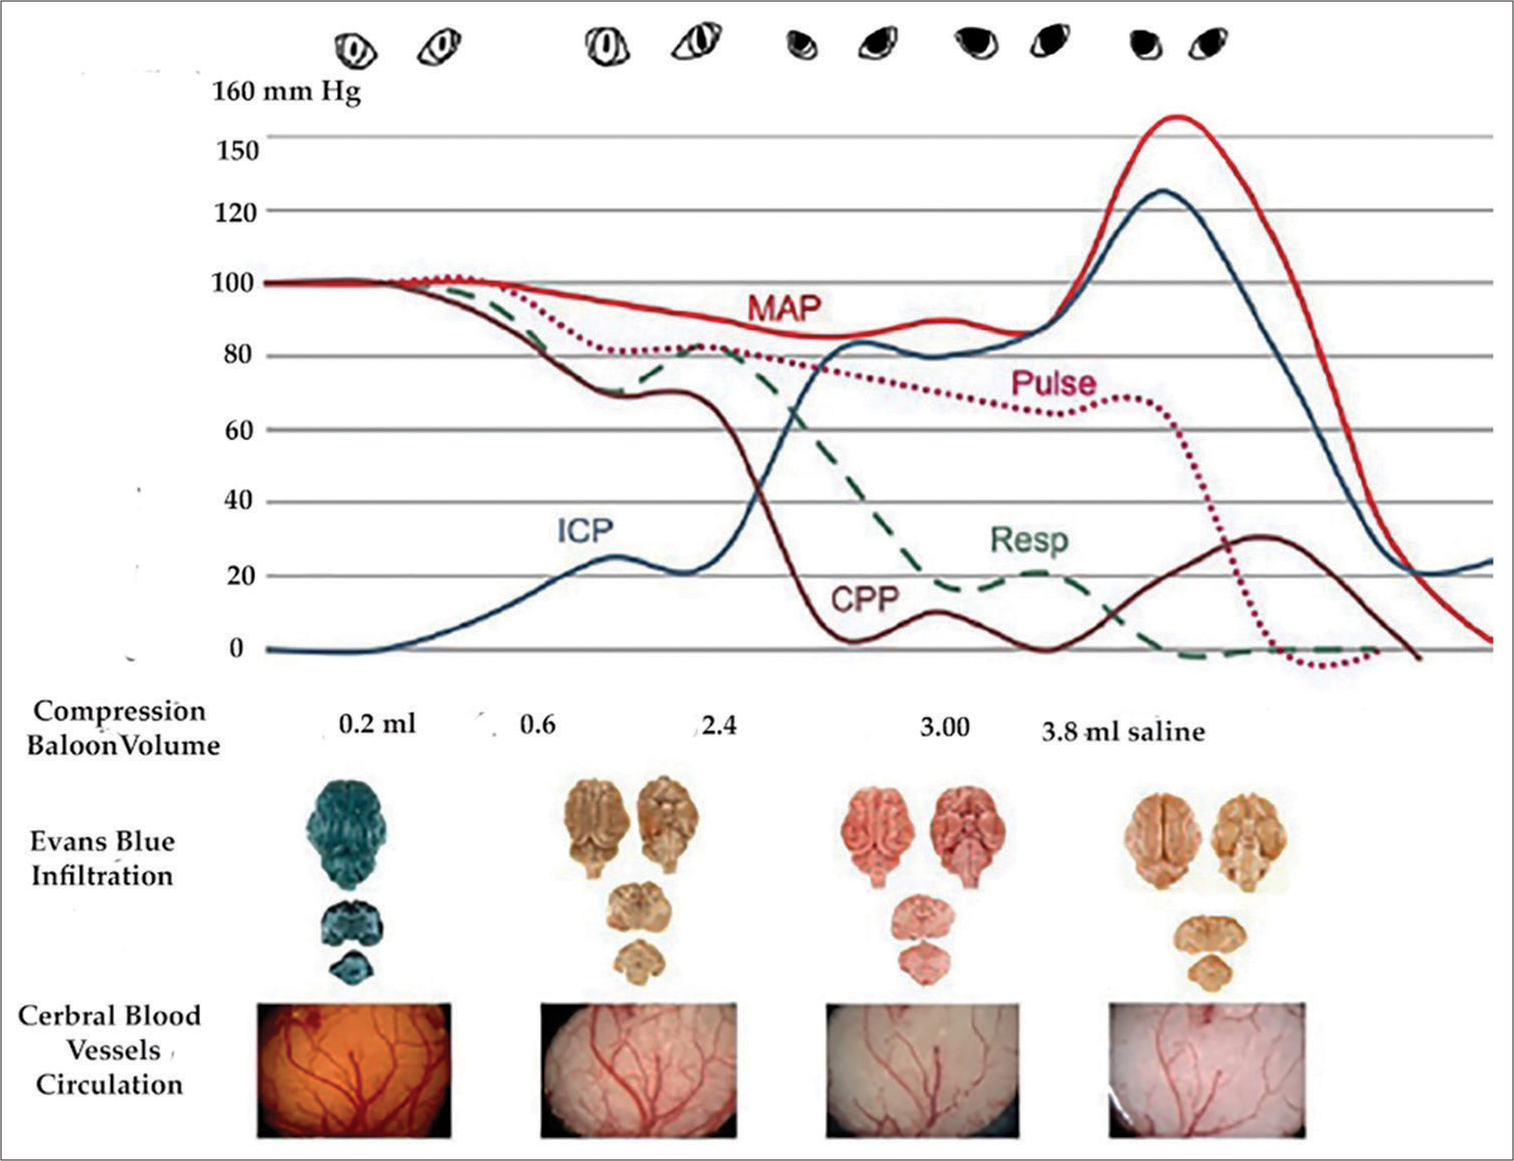
Figure 7:
In vertical arrangement shows the correlation of each stage of significant change in cerebral circulation with vital signs. The highest levels of mean arterial pressure, respiration, and pulse were each taken as 100, and their changes were calculated. Note that when the intracranial pressure reached 25 mm Hg, there was already diminished perfusion of dye in the capillaries and pallor of the cortex. Note progressive obstruction of microvessels, manifested by diminished Evans blue perfusion in the brain’s arterial capillaries, compared to the dense blue color in the normal brain, simultaneous with dilated-fixed pupils coinciding with arrested circulation. ICP: Intracranial pressure, MAP: Mean arterial pressure, CPP: Cerebral perfusion pressure.
DISCUSSION
The concepts of vasodilation, autoregulation, and the benefit of the terminal rise of ICP in cerebral compression have dominated the literature for over half a century. Therefore, new and contrary interpretations of the dynamics require more detailed discussion and explanation; the following is an attempt to do that.
Concept of vasodilation
In 1902, Cushing[
Others followed the notion of vasomotor. Forbes and Wolff[
However, our studies found dilation occurred only in the veins, not in the arteries. To investigate if similar dynamics took place in chronic cerebral compression in another experiment,[
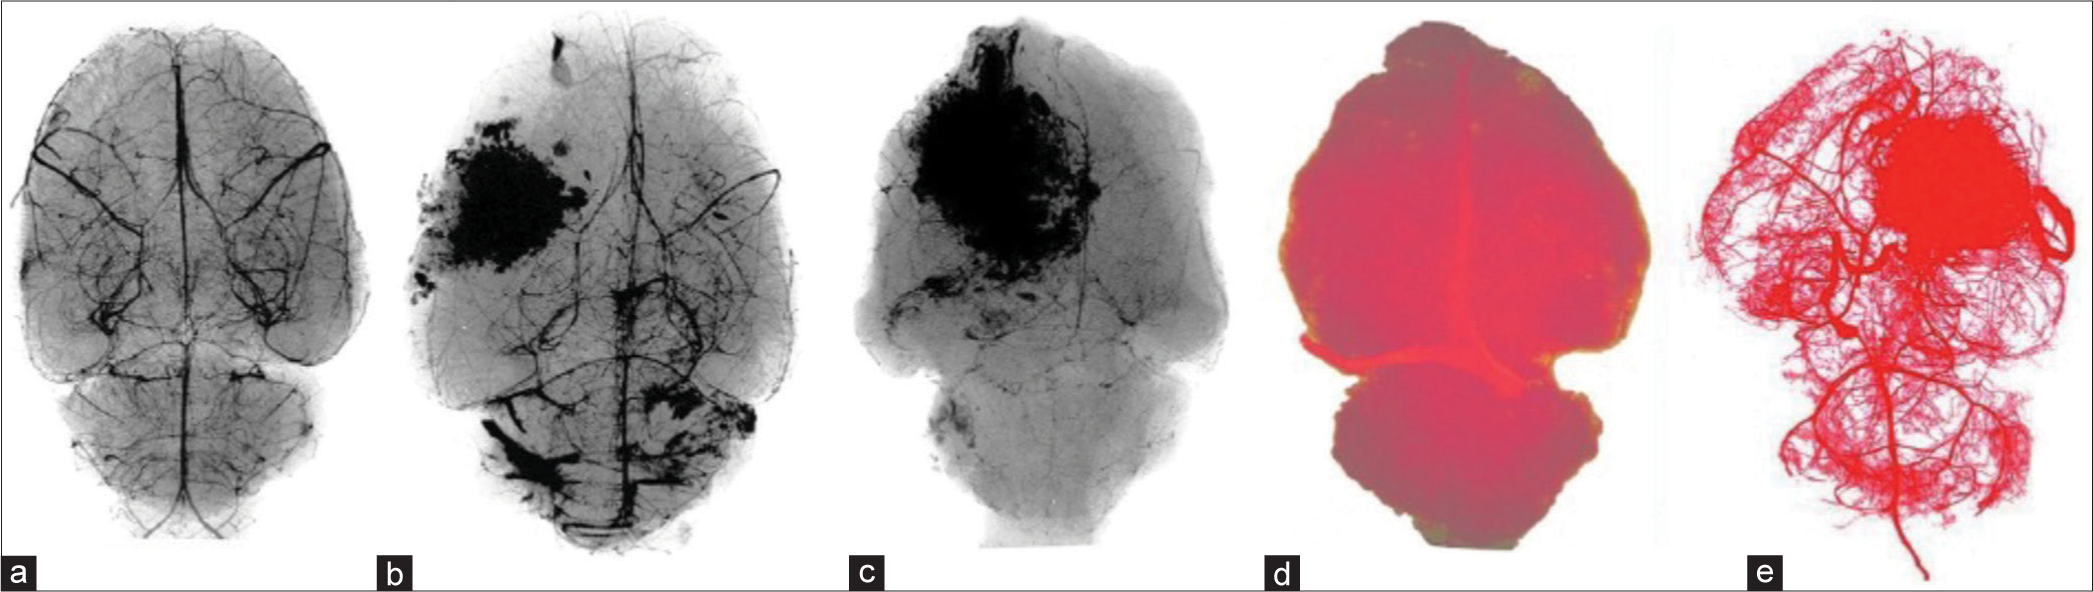
Figure 8:
(a-e) A gradual arterial capillary obstruction in viral-induced tumors in rats by injecting Microbarium (a-c) followed by high magnification X-ray and (d and e) by injecting liquid plastic in ascending aorta. Note obstruction of capillaries in (b and c) as the tumors grew, compared with normal, (a), and in a brain with a tumor in (e) as compared with normal (d).
In addition, in reviewing numerous cerebral angiograms in patients with significant cerebral compression caused by tumors or other conditions, I did not find dilatation of cerebral arteries, except for an artery that supplied a tumor, like in meningiomas, where the arteries were narrowed or obstructed. Mitchell et al.[
Thus, based on this study, the experiment in rats’ brain tumors, and clinical observations, this author concludes that the notion of vasodilation in cerebral compression erroneously conveys arterial dilatation and erroneous interpretation of clinical findings. As cerebral compression and ICP increased, we found continuous arterial capillary obstruction, narrowing of arteries, and decline of cerebral circulation; therefore, we concluded that it is best to name the phenomenon as venodilation.
Concept of autoregulation
The term cerebral autoregulation (CA) has also been linked to cerebral compression, with the notion that it regulates CBF across ranges of 50–150 mean arterial pressure (MAP), and its “failure” is linked to high ICP. However, in cerebral compression, this concept is also based on assumption. In 1976, Lassen and Christensen[
The term autoregulation in cerebral compression is used in numerous other citations in the literature and is taught to neuroscience students despite the vague doubtful mechanisms. Paulson further suggested, “The basic mechanism of autoregulation of CBF is controversial. Most likely, the autoregulatory vessel caliber changes are mediated by an interplay between myogenic and metabolic mechanisms.” Miller et al.,[
Even Cushing[
In a study to find the current knowledge of CA in relation to aspects that could be implemented in the management of traumatic brain injury and its research priority in 2021, Depreitere et al.[
This author, therefore, proposes that the dynamics of the vascular changes in cerebral compression can be explained by the physical elasticity-plasticity of the brain, stress-strain phenomenon, and Hooke’s law as follows.
Explanation 1
Force (F) can stress substances in nature, strain and deform them. For example, a metal rod, rubber, muscle, and collagen fiber with a length of L can be stretched in an amount of ∆L or compressed in an amount of −∆L and a substance with a volume of V can be compressed in an amount of −∆V. Stress designated by sigma (σ) is the amount of force over the area (σ = F/A) of the substance, and strain designated by epsilon (ε) is the ratio of change over the length (ε = ∆L/L). Young’s Modulus (Y) is the ratio of stress over strain, Y = σ/ε, or F/A÷∆L/L, or Y=FL/A∆L. The Modulus for objects with volume is designated by bulk B or K, which is Stress/Strain or Y=σ/ε = ∆P ÷ −∆V/V = or −V∆P/∆V in which ∆P represents the pressure.
Based on Hooke’s law, each substance has a K-constant for x amount of change under (F), or F = Kx, and each substance has a certain degree of elasticity within which it regains its original shape when the stress is removed, but beyond which hardens, deforms, or breaks, not regaining its original shape despite the removal of the stress. Stiffer substances have higher Young’s modulus numbers, requiring more force to deform them.
The brain is also a substance, a heterogeneous one, consisting of elements with elasticity, like fat, as reported by Schoemaker et al.,[
A glance over the internet shows that the elasticity-plasticity graphs of varied substances are similar, varied somewhat by their molecular structure or rigidity. It consists of a rising part representing elasticity, during which, according to Hooke’s law, regains its original shape when the pressure is removed; a flattening part still plastic during which the substance deforms or hardens; and a rising part during which it shears, breaks or declines. Brittle materials have a sharp initial rising curve and break sooner, while ductile materials have a gradual and longer one.
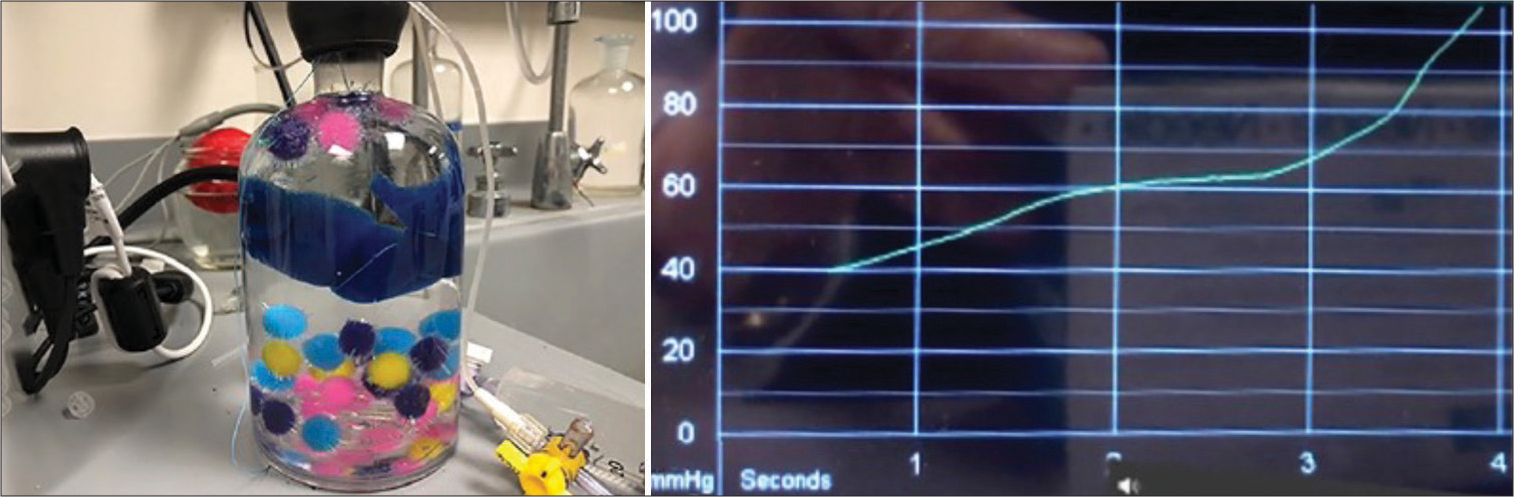
Figure 9:
The graph from the compression of foam pieces in a bottle produced in the lab by this author, using the Camino intracranial pressure monitoring apparatus. Additional water was forced into the bottle, which was already filled with water and sealed. The graph on the right side of the image represents the stress-strain curve found in the compression of substances. It resembles the curve in cerebral compression and “autoregulation.”
The curve is like the ICP curve in
Throughout these experiments, this author never found any evidence for what is expressed as autoregulation and concludes that the alteration of the cerebral circulation in cerebral compression is essentially a dynamic phenomenon based on physics laws and hemodynamics, as discussed below.
In the early stage of cerebral compression and before many veins are obstructed, when the compression raises ICP, the blood squeezes out of the capillaries, making the color of the cortex pale. However, because some blood can still escape into the SS, and some CSF escapes in the spinal canal, the partial drop of ICP allows the blood to return, making the color of the cortex pink again. A similar pallor occurs on the fingernail when it is compressed or in the cortex when the brain is retracted during an operation. The return is not an arterial dilatation or autoregulation; it is caused by the elasticity of the brain tissues, regaining their shape (Hooke’s law) and allowing the blood to return. This is likely what has been interpreted as autoregulation.
However, when ICP rises beyond the capillary pressure and blocks them, the blood would not return despite the partial drop in ICP pressure. That phenomenon is likely what is interpreted as the “failure of autoregulation.” The systolic pressure in the arterioles is reported by Blanco et al.[
Thus, based on this experiment, during which the cerebral circulation was personally observed through the microscope for many hours, a detailed review of their videos, and their correlation with microvessel obstruction, this author concludes that in cerebral compression, there is no evidence of what is called autoregulation. Its concept is assumed and causes erroneous interpretations of laboratory and clinical findings. What takes place is basically caused by the stress-strain phenomenon, and it is more appropriate to call it Cerebral Compartment Syndrome, as it also occurs in muscles by Hargens et al.[
Concept of rising arterial pressure
Dr. Cushing also thought that the rise of systemic arterial pressure was to “overcome the high intracranial tension” to maintain “a proper nutritional supply to the vital centers,” a concept that some still hold. However, based on Poiseuille’s law, we can deduce that the rise is also a dynamic phenomenon: with 2% of body weight, according to Williams and Leggett[
The blood flow Q in vessels correlates directly with the pressure P and conversely with the resistance R, or Q = P/R. That is like Ohm’s law for electric current in wires in which I correlates with current Q, P with voltage V, and conversely with resistant R, or I = V/R. According to Poiseuille’s law, in more detail, the flow Q correlates directly with pressure P and the 4th power of radius r of vessels and conversely with resistant R made up of the osmolarity η of blood and length L of vessels, or Q= Pπr4/8ηL. The P is the pressure difference across the segment of a vessel or P1-P2 or (∆P). Thus, the rise and fall of the pressure increases and decreases the flow.
The brain’s blood vessels, while they divide, function as a parallel arrangement in wires, and the r is the sum of arterial microvessels radii, and the π (pi) is 3.14. In the brain, P1 is MAP and P2 is ICP, and their difference P1-P2 is CPP. By replacing the P in the formula with P1-P2, we have Q=(P1-P2) πr4/8ηL. As the ICP (P2) increases, the P1-P2 decreases the flow Q to the brain [
As a result, the volume of blood (about 750 mL/min) going to the brain gradually backs up in the aorta, raising its volume, raising P1 (the systemic BP) and MAP. Similar phenomena occur elsewhere in the body: the rise of BP in cross-clamping of the aorta in the thoracic region, according to Gelman[
This experiment also shows that in the end, when the BP declined to zero, ICP also dropped to around 25 mmHg without decompressing the pressure balloon,
As an example, in patients with mass lesions, Miller et al.[
Comments
In this paper, the author’s view is about autoregulation in relation to cerebral compression, with no attempt to confirm or refute the presence or absence of autoregulation in general or in biology, nor to cast any doubt on the scientific merit of the outstanding papers mentioned above. It is just a different interpretation of the dynamics of cerebral circulation about concepts of vasodilation, autoregulation, and terminal rise of arterial pressure in cerebral compression.
CONCLUSION
Cerebral compression and rising ICP cause progressive cerebral arterial obstruction that, in turn, causes progressive deterioration of vital signs. When ICP approaches 20 mmHg, it is a warning sign; by approaching 25 mmHg, ipsilateral EEG amplitude declines; and by approaching 40 mmHg, ipsilateral pupils dilate. From there on, with small additional compression, the circulation diminishes rapidly and stops. Simultaneously, vital signs decline, EEG amplitudes become flat, and both pupils become dilated and fixed.
The terms vasodilation and autoregulation convey the wrong dynamics of cerebral circulation: the veins, not the arteries, dilate. Thus, venodilation is the appropriate term. There is no evidence for what is commonly called autoregulation; what occurs is a Cerebral Compartment Syndrome. The terminal rise of arterial pressure is a hemodynamic effect caused by cessations of cerebral circulation overloading the systemic circulation, which raises arterial pressure. None of the above common concepts has any nutritional benefit for the brain; on the contrary, they are associated with ischemia of the brain and deterioration of vital signs.
The volume of a mass that compresses the brain is not the only cause for rising ICP: dilation of veins causing cerebral stagnant, non-circulating blood volume, obstruction of arterial microvessels, and the confined brain in the skull each create specific hemodynamic and pathologic alterations.
Ethical approval
Institutional Review Board approval is not required. No new animal experiments were performed as part of this study. Rather, prior animal studies were performed in the late 1960’s to early 1970’s in the Carlson laboratory facility at the University of Chicago, before the 1985 Institutional Animal Care and Use Committee Requirement (IACUC). Preliminary results from the studies were published in references 11 and 13 of this manuscript.
Declaration of patient consent
Patient’s consent is not required as there are no patients in this study.
Financial support and sponsorship
NIH and nonrestricted philanthropic donation with no attachment to the paper.
Conflicts of interest
There are no conflicts of interest.
Use of artificial intelligence (AI)-assisted technology for manuscript preparation
The authors confirm that there was no use of artificial intelligence (AI)-assisted technology for assisting in the writing or editing of the manuscript and no images were manipulated using AI.
Disclaimer
The views and opinions expressed in this article are those of the authors and do not necessarily reflect the official policy or position of the Journal or its management. The information contained in this article should not be considered to be medical advice; patients should consult their own physicians for advice as to their specific medical needs.
Acknowledgments
USPHS Grant NO supported the experiments. NB-07376–01
The author is aware of the ethical concern for experiments on animals and respects that. The actual animal experiments were done around 1970, before the 1985 Institutional Animal Care and Use Committee (IACUC) requirement. Nevertheless, the animals were purchased by the institutionally established laboratory (Carlson Animal Laboratory) and cared for humanely. Except for the small needle to give intraperitoneal anesthetic, no animal suffered pain.
The author appreciates the contribution of Mr. Joseph Zientarski, a histology technician, to the preparation of the histology study.
The author appreciates the philanthropic nonrestricted contribution to his academic research activities by Mr. Frank Linden and Mr. and Mrs. Samuel Krauss Jr., none of whom had any financial connection to this research.
References
1. Blanco PJ, Muller LO, Spence JD. Blood pressure gradients in cerebral arteries: A clue to pathogenesis of cerebral small vessel disease. Stroke Vasc Neurol. 2017. 2: 108-17
2. Borgdorff P, van den Horn GJ. The effect of common carotid artery occlusion on blood pressure in the barodenervated cat. Pflugers Arch. 1980. 386: 193-7
3. Brassard P, Labrecque L, Smirl JD, Tymko MM, Caldwell HG, Hoiland RL. Losing the dogmatic view of cerebral autoregulation. Physiol Rep. 2021. 9: e14982
4. Cheatham ML. Abdominal compartment syndrome: Pathophysiology and definitions. Scand J Trauma Resusc Emerg Med. 2009. 17: 10
5. Cushing H. Some experimental and clinical observations concerning states of increased intracranial tension. The Mütter lecture for 1901. Am J Med Sci. 1902. 124: 375-400
6. Depreitere B, Citerio G, Smith M, Adelson PD, Aries MJ, Bleck TP. Cerebrovascular autoregulation monitoring in the management of adult severe traumatic brain injury: A Delphi consensus of clinicians. Neurocrit Care. 2021. 34: 731-8
7. Dutov P, Antipova O, Varma S, Orgel JP, Schieber JD. Measurement of elastic modulus of collagen type I single fiber. PLos One. 2016. 11: e0145711
8. Forbes HS, Wolff HG. Cerebral circulation: III. The vasomotor control of cerebral vessels. Arch Neurol Psychiatry. 1928. 19: 1057-86
9. Gelman S. The pathophysiology of aortic cross-clamping and unclamping. Anesthesiology. 1995. 82: 1026-57
10. Hargens AR, Schmidt DA, Evans KL, Gonsalves MR, Cologne JB, Garfin SR. Quantitation of skeletal-muscle necrosis in a model compartment syndrome. J Bone Joint Surg Am. 1981. 63: 631-6
11. Hekmatpanah J. Cerebral circulation and perfusion in experimental increased intracranial pressure. J Neurosurg. 1970. 32: 21-9
12. Hekmatpanah J. Cerebral microvessel perfusion and pathologic alteration of the brain during drowsiness and coma caused by brain tumor: A laboratory study on rats. Surg Neurol. 2007. 67: 564-71 discussion 571
13. Hekmatpanah J. The sequence of alterations in the vital signs during acute experimental increased intracranial pressure. J Neurosurg. 1970. 32: 16-20
14. Kellie G. Transactions of the medico-chirurgical society of Edinburgh. 1824. p. 84-169
15. Langfitt TW, Kassell NF. Non-filling of cerebral vessels during angiography: Correlation with intracranial pressure. Acta Neurochir (Wien). 1966. 14: 96-104
16. Langfitt TW, Weinstein JD, Kassell NF. Cerebral vasomotor paralysis produced by intracranial hypertension. Neurology. 1965. 15: 622-41
17. Lassen NA. Cerebral blood flow and oxygen consumption in man. Physiol Rev. 1959. 39: 183-238
18. Lassen NA, Christensen MS. Physiology of cerebral blood flow. Br J Anaesth. 1976. 48: 719-34
19. Li X, Li Z, Jiang W, Wei J, Xu K, Bai T. Effect of lower extremity amputation on cardiovascular hemodynamic environment: An in vitro study. J Biomech. 2022. 145: 111368
20. Miller JD, Becker DP, Ward JD, Sullivan HG, Adams WE, Rosner MJ. Significance of intracranial hypertension in severe head injury. J Neurosurg. 1977. 47: 503-16
21. Miller JD, Stanek AE, Langfitt TW. A comparison of autoregulation to changes in intracranial and arterial pressure in the same preparation. Eur Neurol. 1971. 6: 34-8
22. Miller JD, Stanek A, Langfitt TW. Concepts of cerebral perfusion pressure and vascular compression during intracranial hypertension. Prog Brain Res. 1972. 35: 411-32
23. Mitchell OC, De La Torre E, Alexander E, Davis CH. The nonfilling phenomenon during angiography in acute intracranial hypertension. Report of 5 cases and experimental study. J Neurosurg. 1962. 19: 766-74
24. Monro A, editors. Observations on the structure and functions of the nervous system. Edinburgh: William Creech; 1783. p.
25. Paulson OB, Strandgaard S, Edvinsson L. Cerebral autoregulation. Cerebrovasc Brain Metab Rev. Summer 1990. 2: 161-92
26. Rangel-Castilla L, Gasco J, Nauta HJ, Okonkwo DO, Robertson CS. Cerebral pressure autoregulation in traumatic brain injury. Neurosurg Focus. 2008. 25: E7
27. Scheinker IM. Changes in cerebral veins in hypertensive brain disease and their relation to cerebral hemorrhage: Clinical pathologic study. Arch Neurol Psychiatry. 1945. 54: 395-408
28. Schoemaker I, Hoefnagel PP, Mastenbroek TJ, Kolff CF, Schutte S, van der Helm FC. Elasticity, viscosity, and deformation of orbital fat. Invest Ophthalmol Vis Sci. 2006. 47: 4819-26
29. Shulman K. Small artery and vein pressures in the subarachnoid space of the dog. J Surg Res. 1965. 5: 56-61
30. Tuna BG, Bakker EN, vanbavel E. Smooth muscle biomechanics and plasticity: Relevance for vascular calibre and remodelling. Basic Clin Pharmacol Toxicol. 2012. 110: 35-41
31. Wahr JA, Gallagher KP, Tait AR, Hantler CB, Knight PR. Hemodynamic alterations and regional myocardial blood flow during supraceliac aortic occlusion in dogs with a critical coronary stenosis. J Cardiothorac Vasc Anesth. 1991. 5: 3-9
32. Williams LR, Leggett RW. Reference values for resting blood flow to organs of man. Clin Phys Physiol Meas. 1989. 10: 187-217
33. Wolff HG, Forbes HS. The cerebral circulation: V. Observations of the pial circulation during changes in intracranial pressure. Arch Neurol Psychiatry. 1928. 20: 1035-47