- Department of Neurosurgery, Harasanshin Hospital, Fukuoka, Japan
- Department of Neurosurgery, Graduate School of Medical Sciences, Kyushu University, Fukuoka, Japan
- Department of Radiology, Harasanshin Hospital, Fukuoka, Japan
- Department of Clinical Chemistry and Laboratory Medicine, Kyushu University Hospital, Fukuoka, Japan
- Department of Neurology, Graduate School of Medical Sciences, Kyushu University, Fukuoka, Japan
- Division of Medical Technology, Department of Health Sciences, Graduate School of Medical Sciences, Kyushu University, Fukuoka, Japan
- Department of Neurosurgery, Hachisuga Hospital, Munakata, Japan.
Correspondence Address:
Takafumi Shimogawa, Department of Neurosurgery, Graduate School of Medical Sciences, Kyushu University, Fukuoka, Japan.
DOI:10.25259/SNI_723_2022
Copyright: © 2023 Surgical Neurology International This is an open-access article distributed under the terms of the Creative Commons Attribution-Non Commercial-Share Alike 4.0 License, which allows others to remix, transform, and build upon the work non-commercially, as long as the author is credited and the new creations are licensed under the identical terms.How to cite this article: Keisuke Abe1, Takafumi Shimogawa2, Nobutaka Mukae2, Koumei Ikuta3, Tadahisa Shono1, Atsuo Tanaka3, Ayumi Sakata4,6, Hiroshi Shigeto5,6, Koji Yoshimoto2, Takato Morioka1,7. Detection of ictal and periictal hyperperfusion with subtraction of ictal-interictal 1.5-Tesla pulsed arterial spin labeling images co-registered to conventional magnetic resonance images (SIACOM). 10-Mar-2023;14:84
How to cite this URL: Keisuke Abe1, Takafumi Shimogawa2, Nobutaka Mukae2, Koumei Ikuta3, Tadahisa Shono1, Atsuo Tanaka3, Ayumi Sakata4,6, Hiroshi Shigeto5,6, Koji Yoshimoto2, Takato Morioka1,7. Detection of ictal and periictal hyperperfusion with subtraction of ictal-interictal 1.5-Tesla pulsed arterial spin labeling images co-registered to conventional magnetic resonance images (SIACOM). 10-Mar-2023;14:84. Available from: https://surgicalneurologyint.com/?post_type=surgicalint_articles&p=12185
Date of Submission
11-Aug-2022
Date of Acceptance
22-Feb-2023
Date of Web Publication
10-Mar-2023
Abstract
Background: Our recent report showed that 1.5-T pulsed arterial spin labeling (ASL) magnetic resonance (MR) perfusion imaging (1.5-T Pulsed ASL [PASL]), which is widely available in the field of neuroemergency, is useful for detecting ictal hyperperfusion. However, the visualization of intravascular ASL signals, namely, arterial transit artifact (ATA), is more remarkable than that of 3-T pseudocontinuous ASL and is easily confused with focal hyperperfusion. To eliminate ATA and enhance the detectability of (peri) ictal hyperperfusion, we developed the subtraction of ictal-interictal 1.5-T PASL images co-registered to conventional MR images (SIACOM).
Methods: We retrospectively analyzed the SIACOM findings in four patients who underwent ASL during both (peri) ictal and interictal states and examined the detectability for (peri) ictal hyperperfusion.
Results: In all patients, the ATA of the major arteries was almost eliminated from the subtraction image of the ictal-interictal ASL. In patients 1 and 2 with focal epilepsy, SIACOM revealed a tight anatomical relationship between the epileptogenic lesion and the hyperperfusion area compared with the original ASL image. In patient 3 with situation-related seizures, SIACOM detected minute hyperperfusion at the site coinciding with the abnormal electroencephalogram area. SIACOM of patient 4 with generalized epilepsy diagnosed ATA of the right middle cerebral artery, which was initially thought to be focal hyperperfusion on the original ASL image.
Conclusion: Although it is necessary to examine several patients, SIACOM can eliminate most of the depiction of ATA and clearly demonstrate the pathophysiology of each epileptic seizure.
Keywords: Arterial spin labeling, Ictal hyperperfusion, SISCOM, Subtraction
INTRODUCTION
Arterial spin labeling (ASL) is a neuroimaging technique that non-invasively quantifies cerebral blood flow (CBF). Acting as a diffusible tracer, water proton nuclear spins in arterial blood are labeled by the application of a radiofrequency (RF) pulse that inverts them at the level of the cervical arteries.[
There are two distinct labeling methods for the clinical use of ASL: Pulsed ASL (PASL) and pseudocontinuous ASL (pCASL).[
Single-photon emission computed tomography (SPECT), a preoperative examination for epilepsy surgery, is often used to identify the hypoperfusion area during the interictal period and hyperperfusion area during the ictal period in patients with drug-resistant epilepsy. In these cases, it is evident that the subtraction of ictal-interictal SPECT co-registered to magnetic resonance imaging (MRI) (SISCOM), which subtracts the interictal SPECT image from the ictal SPECT image and superimposes it on the anatomical MR image, is useful for localizing the epileptogenic zone.[
MATERIALS AND METHODS
Patients
From June 2021 to June 2022, 51 patients underwent control of epileptic ictus either as neuroemergency cases or postoperatively at our hospital. Most patients underwent neuroradiological examinations, such as computed tomography or conventional MRI combined with routine electroencephalogram (EEG), within 2 days of onset. In 10 (17.3%) of the 51 patients, PASL sequences were added to the conventional MRI examination for clinical purposes depending on the patient’s condition and at the discretion of the attending physicians. Of these ten patients, we retrospectively selected four patients (three women and one man; mean age, 70 years; range, 57–85 years) who underwent both ASL and EEG during both ictal and interictal states [
ASL imaging
MRI was performed using a 1.5-T scanner (MAGNETOM Aera; Siemens, Erlangen, Germany) equipped with a 20-channel head/neck coil as previously described.[
To obtain SIACOM, the data from each voxel of the ictal ASL were automatically subtracted from the data from the corresponding voxel of the interictal ASL using a clinically used volume analyzer SYNAPSE VINCENT (Fujifilm, Tokyo, Japan) as previously described.[
EEG
Routine EEG recordings were obtained using a digital EEG machine (Neurofax 1200; Nihon-Kohden, Tokyo, Japan), with electrode placement according to the International EEG 10-20 system. EEG recordings were performed for at least 30 min. The evaluation of EEG findings was performed on visual inspection by two board-certified electroencephalographers (T.M. and H.S.) who were blinded to the clinical data based on the critical care EEG terminology proposed by the American Clinical Neurophysiological Society in 2021.[
RESULTS
The clinical profiles and the EEG, and SIACOM findings of the four patients are summarized in
Patient 1
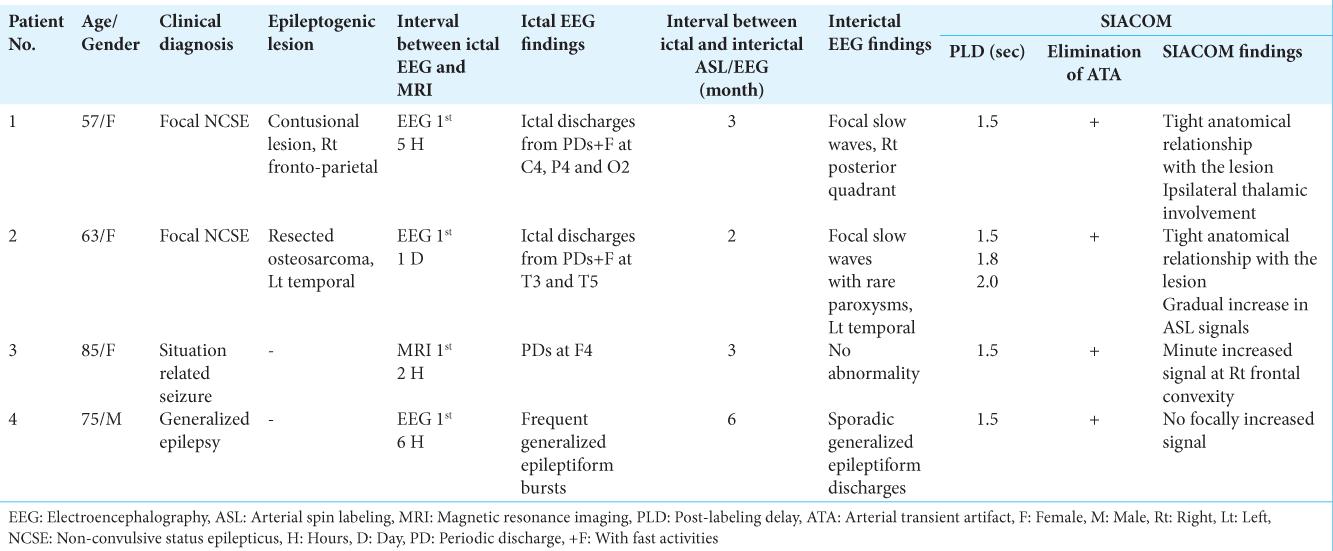
A 57-year-old woman had a head injury due to a fall 4 years prior and underwent craniotomy for a right acute subdural hematoma at our hospital. MRI revealed three contusional lesions in the convexity of the right frontoparietal lobe, right frontal base, and right frontal pole [
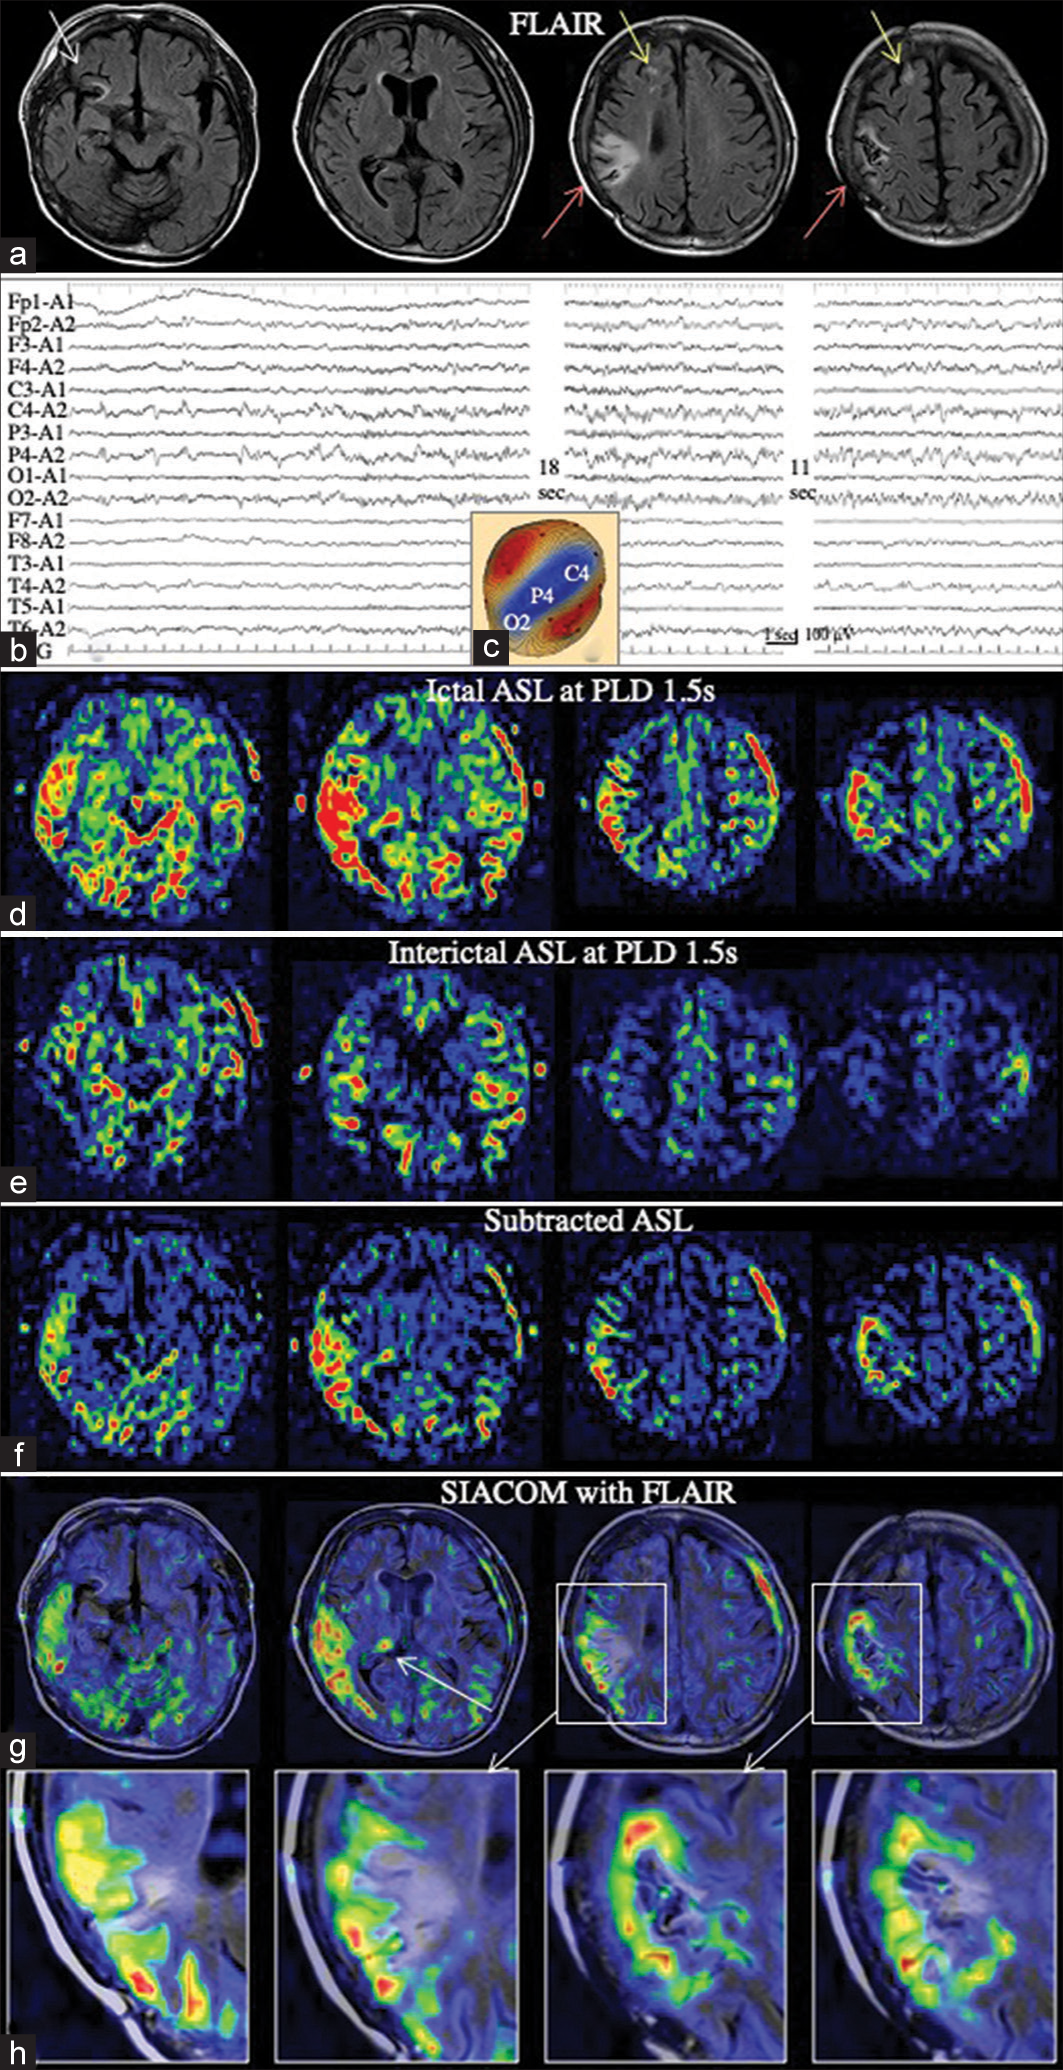
Figure 1:
Patient 1 (a) Magnetic resonance (MR) images with fluid attenuated inversion recovery sequences (FLAIR) shows three contusional lesions in the right fronto-parietal lobe (red arrows), right frontal base (white arrow), and right frontal pole (yellow arrow). (b) Electroencephalogram (EEG) demonstrates lateralized periodic discharges (LPDs) with fast wave activities (+F) in the right parietocentro-occipital lesion, which becomes ictal discharges. (c) Voltage topography depicts that the maximal amplitude of negativity (indicates blue) of LPD is located at P4, C4, and O2 of International EEG 10-20 system. (d) MR perfusion image with arterial spin labeling (ASL) at post-labeling delay (PLD) of 1.5 s during ictal periods shows increased ASL signals in the right posterior cortex, in addition to the arterial transit artifact (ATA) of the middle cerebral arteries (MCAs) and posterior cerebral arteries (PCAs) on both sides. (e) Interictal ASL at a PLD of 1.5 s fails to reveal the site of increased ASL signal, while the ATA of the bilateral MCAs and PCAs are observed. (f) Subtraction of the ictal ASL from the interictal ASL (subtracted ASL) demonstrates that the ATA of the bilateral MCAs and PCAs is mostly eliminated, and the increase in cerebral blood flow in the right posterior quadrant becomes prominent. (g and h) Subtraction of ictal-interictal ASL images co-registered to FLAIR images (SIACOM) reveals that an increase in ASL signals occurs from the cortical convex on and the cortex in the sulcus around the contusional lesion of the right fronto-parietal lobe, and extends to the ipsilateral temporal lobe. Increased ASL signal in the ipsilateral thalamus is also revealed (white arrow). (h) Shows enlarged views around the contusional lesion on (g).
Interictal ASL, which was performed at the outpatient service 3 months after her epileptic ictus, showed no site of increased signal, while the ATA of the bilateral MCAs and PCAs were observed [
Patient 2
The 63-year-old woman, as previously reported,[
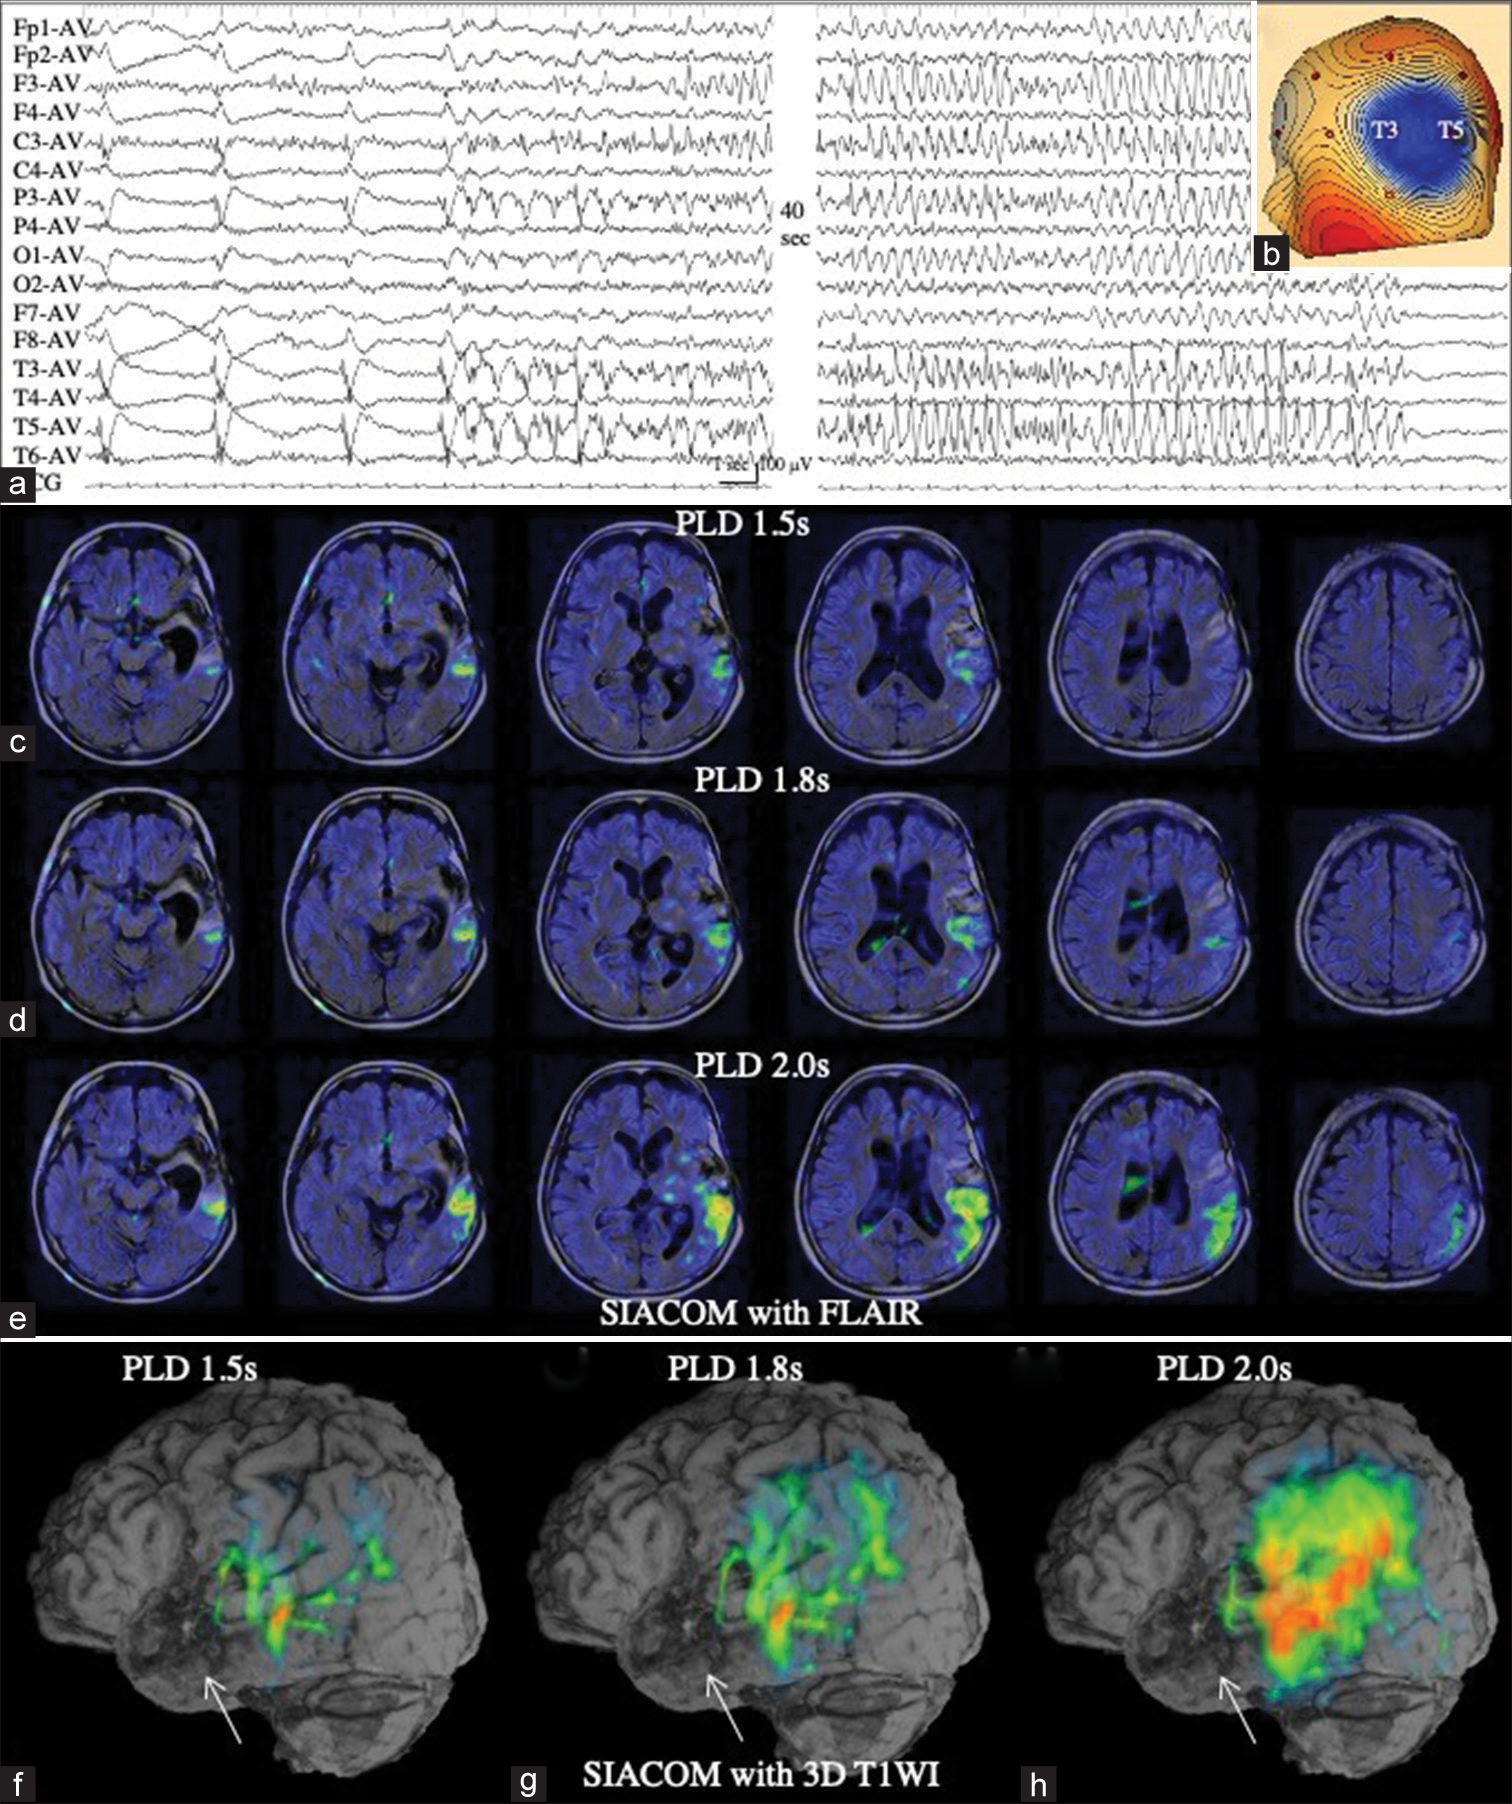
Figure 2:
Patient 2 (a) Electroencephalography (EEG) shows lateralized periodic discharges (LPDs)+F persist on the left temporal region, spread to the left fronto-parietal region, and become ictal discharges on the left hemisphere. (b) Voltage topography indicates that the maximal amplitude of the negativity of LPD is located at T3 and T5. (c-e) SIACOM, which was superimposed on the fluid attenuated inversion recovery sequences, show arterial spin labeling (ASL) signals posterior to the surgical scar at the left temporal lobe is focally increased at a post-labeling delay (PLD) of 1.5 s (c). At a PLD of 1.8 s, the site is extended to the posterior temporal and parietal lobes (d). The signals are further increased at a PLD of 2.0 s (e). (f-h) When the subtracted ASL of each PLD is superimposed on the lateral view of the three-dimensional image created from 3-dimensional T1-weighted images, a gradual extension and increase of the ASL signals occurs in the posterior temporal and parietal cortices posterior to the surgical scar (white arrow) is demonstrated.
Patient 3
An 85-year-old woman had been taking hypnotics and neuroleptics, including zopiclone, brotizolam, suvorexant, and etizolam, for insomnia for a long time. However, the patient suddenly stopped taking these medications when she underwent bladder hydrodilation for interstitial cystitis under general anesthesia. Although she had no problems with surgery and anesthesia, she developed convulsive SE at night after surgery. Her seizures were controlled with the intravenous administration of DZP and fPHT. She underwent MRI 6 h later, which failed to reveal any epileptogenic lesions. As ASL with a PLD of 1.5 s showed a marked ATA depiction of the major arteries at the bottom of her brain, it was difficult to determine a minute increase in ASL signals in the right frontal lobe [

Figure 3:
Patient 3 (a) Ictal arterial spin labeling (ASL) at a post-labeling delay (PLD) of 1.5 s shows a marked arterial transit artifact (ATA) depiction of the major arteries, while it is difficult to determine a minute increase in ASL signals in the right frontal lobe (white arrow). (b) Electroencephalography demonstrates lateralized periodic discharges (LPDs) in the right frontal region. (c) Voltage topography shows that the maximal amplitude of the negativity of LPD is located at F4. (d) Interictal ASL at a PLD of 1.5 s again shows a marked ATA depiction. (e) On the subtracted ASL, ATA is mostly eliminated and minute increase of ASL signal at the right frontal lobe becomes prominent (white arrow). (f) SIACOM, which is created with source images of magnetic resonance angiography, shows the increased ASL signal site is at the convexity of the right frontal base (white arrows). On serial SIACOM with a slice width of 0.6 mm, this increase in ASL signal was observed over 20 slices, that is, with a width of 1.2 cm, and the figures show, from the left, the most ventral part, the central part, and the most dorsal part of the increased ASL signal areas of right frontal base. Other remaining signals are identified as ATA, because they correspond to the subarachnoid space, including the bilateral ambient cisterns and frontal interhemispheric cistern, or arteries therein.
Patient 4
A 75-year-old man initially developed generalized tonic-clonic seizures and was admitted to the emergency department. On arrival, he had no convulsions and his consciousness was almost clear. EEG examination revealed frequent generalized epileptiform bursts [
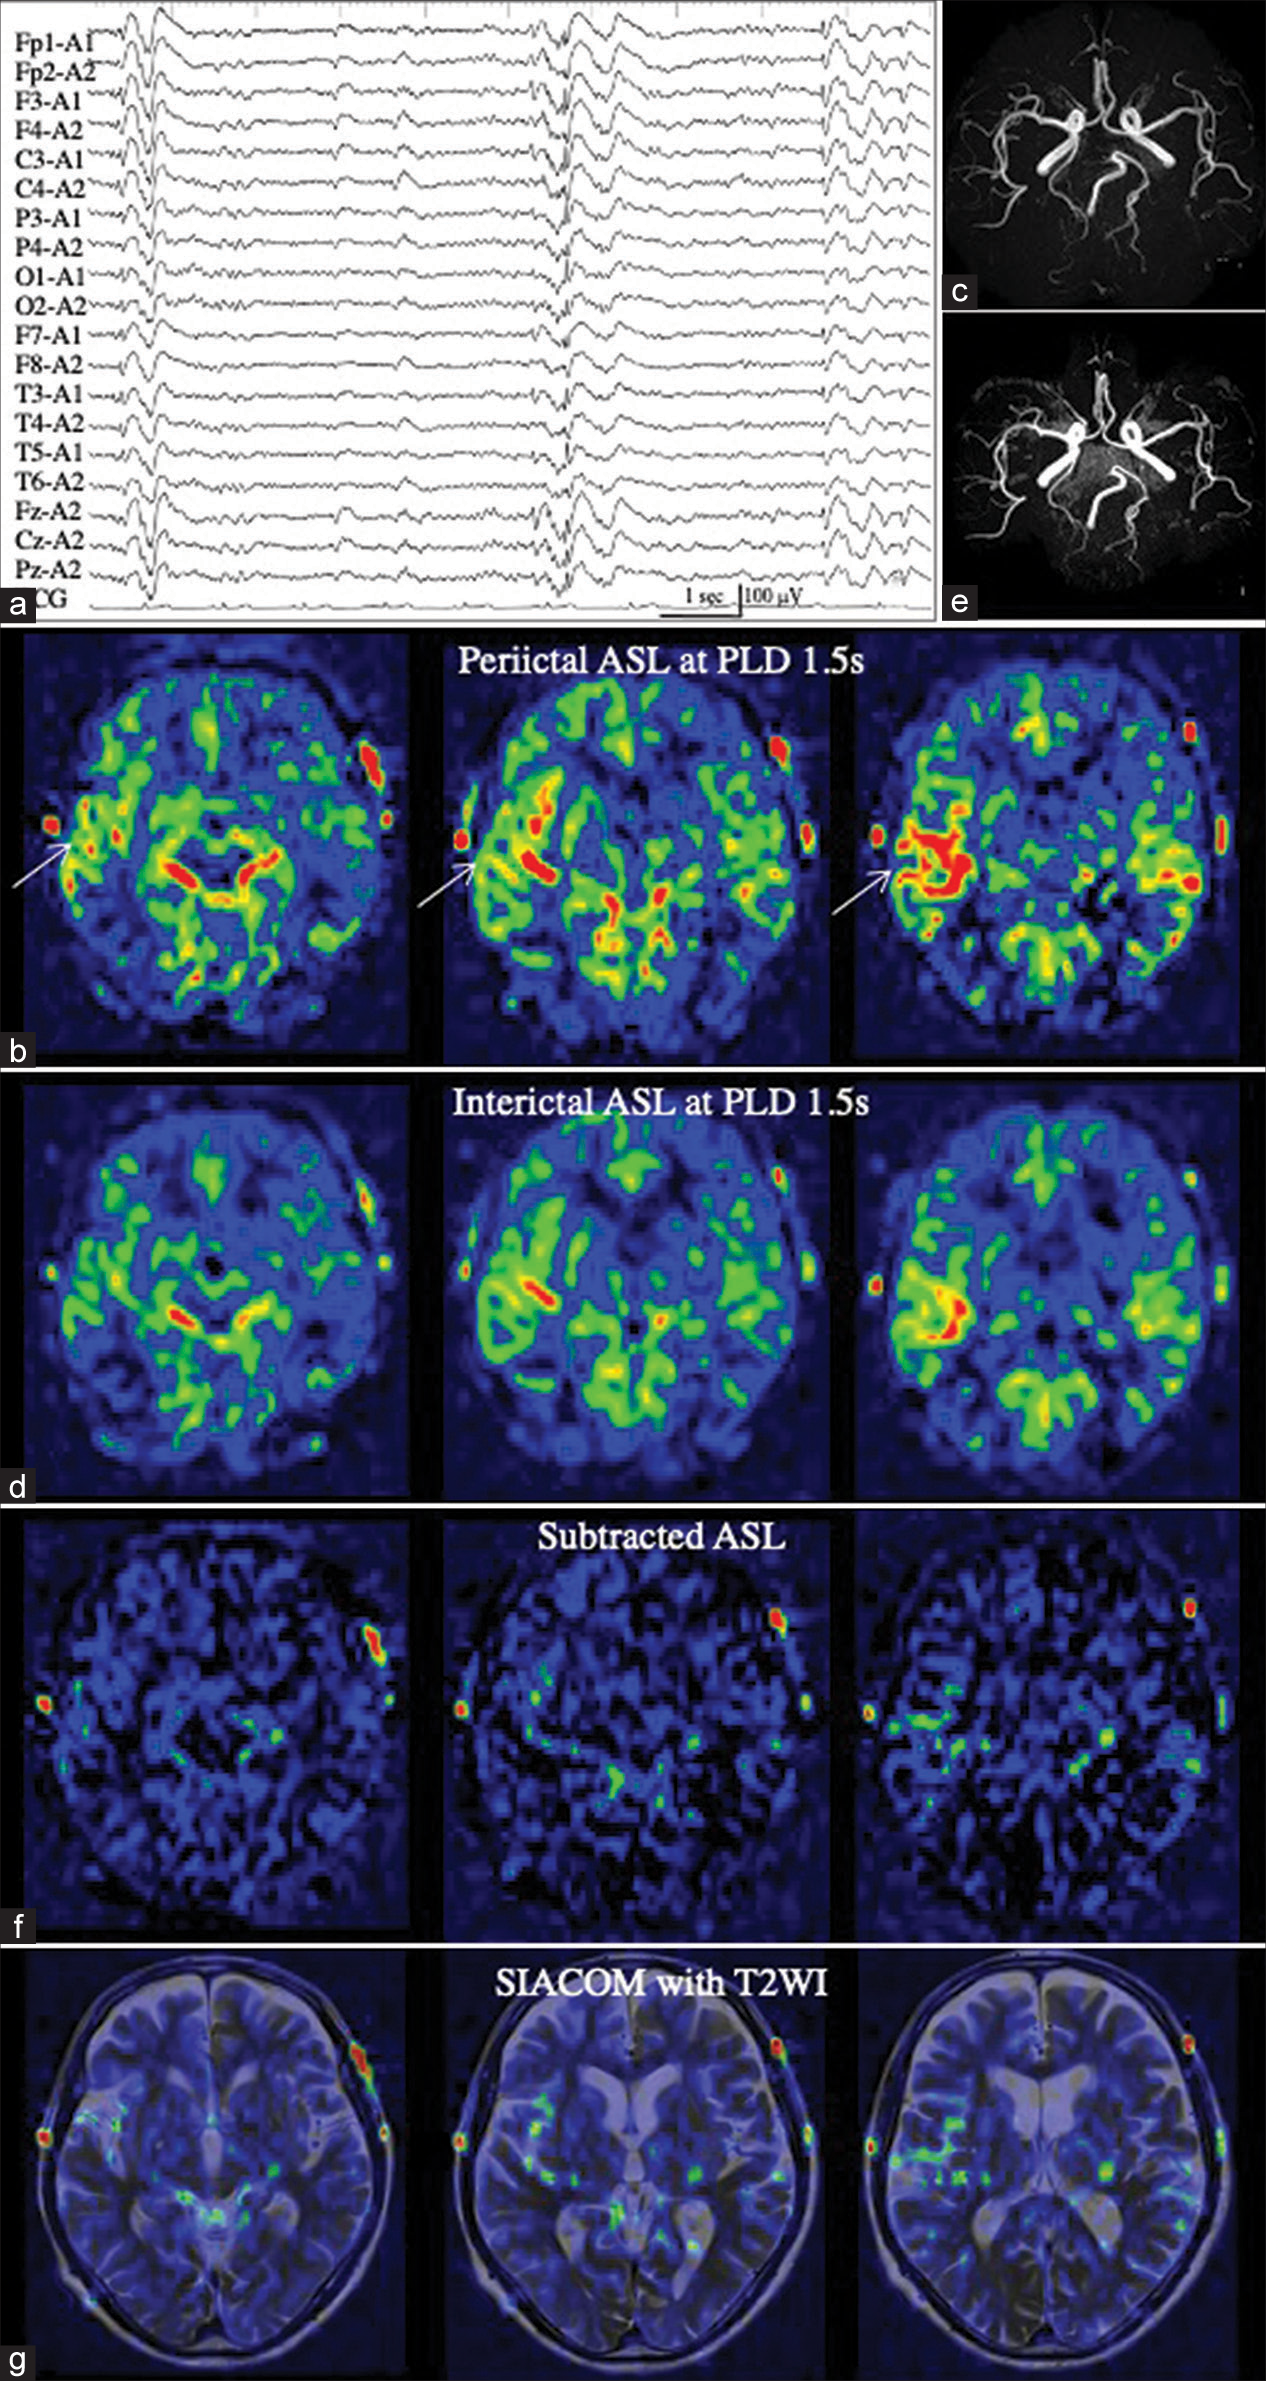
Figure 4:
Patient 4 (a) Electroencephalography showing frequent generalized epileptiform bursts. (b) Periictal arterial spin labeling (ASL) at a post-labeling delay (PLD) of 1.5 s shows increased ASL signals in the right frontal lobe (white arrow). Even when compared with magnetic resonance (MR) angiography (c), it is not possible to determine whether it is the arterial transit artifact (ATA) of the middle cerebral arteries or increased tissue cerebral blood flow. (d and e) Interictal ASL at a PLD of 1.5 s (d) and MR angiography (e) demonstrate findings similar to those of periictal ASL. (f) On the subtracted ASL, the increased ASL signal in the right frontal lobe is almost eliminated (f). (g) SIACOM, superimposed on T2-weighted images, shows that slightly increased residual signals are present within the subarachnoid space.
DISCUSSION
This study revealed the possibility of subtraction of ictalinterictal 1.5-T PASL images to considerably eliminate the depiction of ATA in all four patients. In addition, by creating SIACOM from the subtracted ASL, the pathophysiology of the seizure in each patient was more clearly demonstrated than that in the original ictal ASL image.
In patients 1 and 2 with focal epilepsy, a tight topographical relationship between the epileptogenic lesions and site of increased CBF was clearly depicted. We previously investigated the hemodynamics of periictal hyperperfusion using 3-T pCASL with the dual PLD method and reported that the flow velocity of periictal hyperperfusion was high in patients with structural focal epilepsy.[
Conversely, in Patient 2, SIACOM clearly revealed that the slight increase in CBF at a PLD of 1.5 s, which was visualized posterior to the lesion, gradually increased in intensity and extent at a PLD of 1.8 s and 2.0 s. These hemodynamic changes, which could be visualized by taking advantage of the characteristic that ASL is susceptible to arterial transit time (ATT),[
In Patient 3 with situation-related seizures, SIACOM revealed a minute increase in CBF in the area consistent with the abnormal EEG region. In general, the development of ictal hyperperfusion on 3-T pCASL depends on the electrophysiological intensity or power of the epileptic ictus,[
In Patient 4 with generalized epilepsy, increased CBF focally in the right frontal lobe was suspected with periictal ASL; however, SIACOM revealed that the increased ASL signals were the ATA of the right M2, M3, and M4 portions of the MCA. Few reports have captured periictal hyperperfusion with ASL in patients with generalized epilepsy. Chen et al.,[
Fukuma et al.[
The present study has some limitation. First, the degree of ATA visualization may differ between the (peri) ictal and interictal states. On 3-T pCASL, ATA is visualized when labeled blood flow stagnates in the artery due to changes in hemodynamics associated with steno-occlusion or a giant aneurysm of the internal carotid artery.[
CONCLUSION
Although it is necessary to examine several patients in the future, SIACOM can mostly eliminate the depiction of ATA, which is one of the weakest points of 1.5-T PASL, and clearly demonstrate the pathophysiology of epileptic seizures.
Declaration of patient consent
The authors certify that they have obtained all appropriate patient consent.
Financial support and sponsorship
This work was supported by a Grant-in-Aid for Scientific Research from the Japan Society for the Promotion of Science (JSPS) (JP21K17456 to T.S.).
Conflicts of interest
There are no conflicts of interest.
Disclaimer
The views and opinions expressed in this article are those of the authors and do not necessarily reflect the official policy or position of the Journal or its management. The information contained in this article should not be considered to be medical advice; patients should consult their own physicians for advice as to their specific medical needs.
Acknowledgments
We thank Takashi Nakakogawa, Yasunobu Yoshitake, and their colleagues at Harasanshin Hospital for supporting our study.
References
1. Akiyama T, Morioka T, Shimogawa T, Haga S, Sayama T, Kanazawa Y. Arterial spin-labeling magnetic resonance imaging with dual post-labeling delay in internal carotid artery steno-occlusion: Validation with digital subtraction angiography. J Stroke Cerebrovasc Dis. 2016. 25: 2099-108
2. Alsop DC, Detre JA, Golay X, Günther M, Hendrikse J, Hernandez-Garcia L. Recommended implementation of arterial spin-labeled perfusion MRI for clinical applications: A consensus of the ISMRM perfusion study group and the European consortium for ASL in dementia. Magn Reson Med. 2015. 73: 102-16
3. Bambach S, Smith M, Morris PP, Campeau NG, Ho ML. Arterial spin labeling applications in pediatric and adult neurologic disorders. J Magn Reson Imaging. 2022. 55: 698-719
4. Chen G, Lei D, Ren J, Zuo P, Suo X, Wang DJ. Patterns of postictal cerebral hyperperfusion in idiopathic generalized epilepsy: A multi-delay multiparametric arterial spin labelling perfusion MRI study. Sci Rep. 2016. p. 6 28867
5. Dolui S, Vidorreta M, Wang Z, Nasrallah IM, Alavi A, Wolk DA. Comparison of PASL, PCASL, and background suppressed 3D PCASL in mild cognitive impairment. Human Brain Mapp. 2017. 38: 5260-73
6. Fukuma K, Kajimoto K, Tanaka T, Takaya S, Kobayashi K, Shimotake A. Visualizing prolonged hyperperfusion in post-stroke epilepsy using postictal subtraction SPECT. J Cereb Blood flow Metab. 2021. 41: 146-56
7. Funakoshi Y, Shono T, Kurogi A, Kono S. Osteosarcoma of the temporal bone occurring 40 years after radiotherapy: A technical case report. Surg Neurol Int. 2021. 12: 152
8. Goto K, Shimogawa T, Mukae N, Shono T, Fujiki F, Tanaka A. Implications and limitations of magnetic resonance perfusion imaging with 1.5-Tesla pulsed arterial spin labeling in detecting ictal hyperperfusion during nonconvulsive status epilepticus. Surg Neurol Int. 2022. 13: 147
9. Haga S, Morioka T, Shimogawa T, Akiyama T, Murao K, Kanazawa Y. Arterial spin labeling perfusion magnetic resonance image with dual postlabeling delay: A correlative study with acetazolamide loading 123I-Iodoanphetamine single-photon emission computed tomography. J Stroke Cerebrovasc Dis. 2016. 25: 1-6
10. Haga S, Morioka T, Kameda K, Takahara K, Amano T, Tomohara S. Subtraction of arterial spin-labeling magnetic resonance perfusion images acquired at dual post-labeling delay: Potential for evaluating cerebral hyperperfusion syndrome following carotid endarterectomy. J Clin Neurosci. 2019. 63: 77-83
11. Hirsch LJ, Fong MW, Leitinger M, LaRoche SM, Beniczky S, Abend NS. American Clinical Neurophysiology Society’s standardized critical care EEG terminology: 2021 version. J Clin Neurophysiol. 2021. 38: 1-29
12. Kanazawa Y, Morioka T, Arakawa S, Furuta Y, Nakanishi A, Kitazono T. Nonconvulsive partial status epilepticus mimicking recurrent infarction revealed by diffusion-weighted and arterial spin labeling perfusion magnetic resonance images. J Stroke Cerebrovasc Dis. 2015. 24: 731-8
13. Kanazawa Y, Arakawa S, Shimogawa T, Hagiwara N, Haga S, Morioka T. Arterial spin labeling magnetic resonance imaging for differentiating acute ischemic stroke from epileptic disorders. J Stroke Cerebrovasc Dis. 2019. 28: 1684-90
14. Matsuda H, Matsuda K, Nakamura F, Kameyama S, Masuda H, Otsuki T. Contribution of subtraction ictal SPECT coregistered to MRI to epilepsy surgery: A multicenter study. Ann Nucl Med. 2009. 23: 283-91
15. Murao K, Morioka T, Shimogawa T, Furuta Y, Haga S, Sakata A. Various pathophysiological states of acute symptomatic seizures immediately after ischemic stroke, namely “onset seizures”, shown by complementary use of peri-ictal magnetic resonance imaging and electroencephalography. Neurol Clin Neurosci. 2017. 5: 169-77
16. O’Brien TJ, So EL, Mullan BP, Hauser MF, Brinkmann BH, Bohnen NI. Subtraction ictal SPECT coregistered to MRI improves clinical usefulness of SPECT in localizing the seizure focus. Neurology. 1998. 50: 445-54
17. Ohtomo S, Otsubo H, Arai H, Shimoda Y, Homma Y, Tominaga T. Hyperperfusion in the thalamus on arterial spin labelling inidicates non-convulsive status epilepticus. Brain Commun. 2020. 3: fcaa223
18. Shimogawa T, Morioka T, Sayama T, Haga S, Kanazawa Y, Murao K. The initial use of arterial spin labeling perfusion and diffusion-weighted magnetic resonance images in the diagnosis of nonconvulsive partial status epilepticus. Epilepsy Res. 2017. 129: 162-73
19. Shimogawa T, Morioka T, Akiyama T, Haga S, Arakawa S, Sayama T. Sequential changes of arterial spin-labeling perfusion MR images with dual postlabeling delay following reconstructive surgery for giant internal carotid artery aneurysm. Surg Neurol Int. 2017. 8: 222
20. Shirozu N, Morioka T, Tokunaga S, Shimogawa T, Inoue D, Arihiro S. Comparison of pseudocontinuous arterial spin labeling perfusion MR images and time-of-flight MR angiography in the detection of periictal hyperperfusion. eNeurologicalSci. 2020. 19: 100233
21. Soldozy S, Galindo J, Snyder H, Ali Y, Norat P, Yaĝmurlu K. Clinical utility of arterial spin labeling imaging in disorders of the nervous system. Neurosurg Focus. 2019. 47: E5
22. Takahara K, Morioka T, Shimogawa T, Haga S, Kameda K, Arihiro S. Hemodynamic state of periictal hyperperfusion revealed by arterial spin-labeling perfusion MR images with dual postlabeling delay. eNeurologicalSci. 2018. 12: 5-18
23. Tokunaga S, Morioka T, Shirozu N, Tsurusaki Y, Arihiro S, Shimogawa T. Arterial spin-labeling perfusion MR images with dual postlabeling delay reveals hemodynamic changes in dural arteriovenous fistulas following endovascular surgery. Interdiscip Neurosurg. 2020. 21: 100733
24. Wakisaka K, Morioka T, Shimogawa T, Murao K, Kanazawa Y, Hagiwara N. Epileptic ictal hyperperfusion on arterial spin labeling perfusion and diffusion-weighted magnetic resonance images in posterior reversible encephalopathy syndrome. J Stroke Cerebrovasc Dis. 2016. 25: 228-37
25. Young CO, Etchbehere EC, Souza EM, Brunetto SQ, de Oliveira Santos A, Lima MC. Clinical usefulnesss of SISCOMSPM compared to visual analysis to locate the epileptogenic zone. Front Neurol. 2020. 11: 467