- Department of Orthopaedics and Rehabilitation, University of Texas, Houston, TX, USA
- Department of Orthopaedics and Rehabilitation, University of Rochester, Rochester, NY, USA
- Department of Orthopaedics, VA Medical Center, Ashville, NC, USA
Correspondence Address:
Mark L. Prasarn
Department of Orthopaedics, VA Medical Center, Ashville, NC, USA
DOI:10.4103/2152-7806.156606
Copyright: © 2015 Prasarn ML. This is an open-access article distributed under the terms of the Creative Commons Attribution License, which permits unrestricted use, distribution, and reproduction in any medium, provided the original author and source are credited.How to cite this article: Prasarn ML, Kostantinos V, Coyne E, Wright J, Rechtine GR. Does lumbar paraspinal muscle fatty degeneration correlate with aerobic index and Oswestry disability index?. Surg Neurol Int 07-May-2015;6:
How to cite this URL: Prasarn ML, Kostantinos V, Coyne E, Wright J, Rechtine GR. Does lumbar paraspinal muscle fatty degeneration correlate with aerobic index and Oswestry disability index?. Surg Neurol Int 07-May-2015;6:. Available from: http://surgicalneurologyint.com/surgicalint_articles/lumbar-paraspinal-muscle-fatty-degeneration-correlate/
Abstract
Background:We sought to analyze whether the amount of paraspinal fatty degeneration correlates with a patient's physical fitness, and to determine if these findings on lumbar magnetic resonance imaging (MRI) scans can help predict functional outcomes.
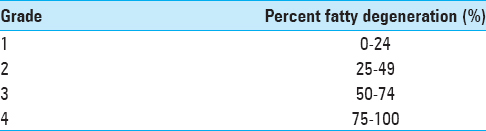
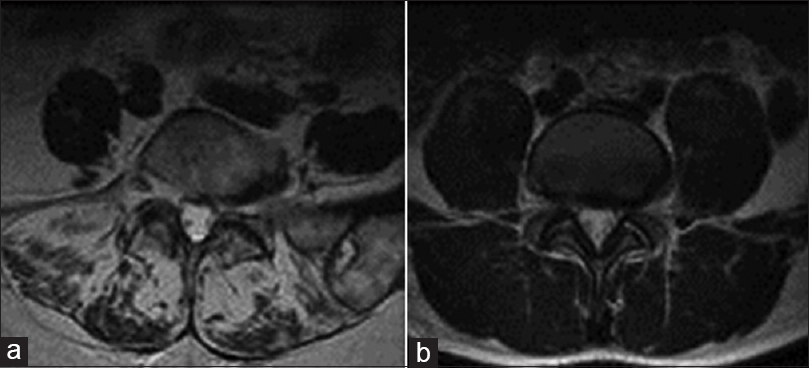
Methods:A retrospective review was performed on 172 patients. Inclusion criteria involved being seen by a spine surgeon for low back pain, having aerobic index (AI), body mass index (BMI), Oswestry disability index (ODI), and body fat percentage measured recently, and having had a recent lumbar MRI scan. The percentage of fatty muscle degeneration was graded by three reviewers using T2-weighted axial images at L3 and L5 using a newly proposed system that was validated independently. The system is graded as follows: Grade 1: 0-24%, Grade 2: 25-49%, Grade 3: 50-74%, and Grade 4: 75-100%. An independent t-test was used for comparisons.
Results:The average AI was 34.87, and the cohort was divided into two groups: above-average AI (89 patients) and below-average AI (83 patients). For all paraspinal fat measurements and body fat percentage, the difference between the above- and below-average AI groups was statistically significant (P P = 0.491 and P = 0.122, respectively). There was a trend for lower ODI scores in the above-average AI group (41.9 vs 46.1), but this did not reach statistical significance between the two groups (P = 0.075). For all patients it was shown that there was significantly less paraspinal fat at the L3 level as compared to L5 (P
Conclusions:We were able to show that patients with a higher AI have lower body fat percentages and lower amounts of fatty degeneration in their lumbar paraspinal musculature. The amount of paraspinal fatty degeneration, therefore, correlates with physical fitness. Patients with higher AI also showed a trend toward having a lower ODI score.
Keywords: Fatty degeneration, fitness, lumbar spine, magnetic resonance imaging, paraspinal muscle
INTRODUCTION
Studies have demonstrated an association between paraspinal muscular insufficiency and both the development and persistence of low back pain (LBP).[
METHODS
The present study protocol was approved by the institutional review board. The outcome measures used in the correlation analysis were regularly collected data during routine physician and physical therapy visits. Participants were excluded from the study if they had had any previous surgical interventions in their lumbar spine. Inclusion criteria were as follows: age over 18, having had a recent lumbar MRI scan, and having measured ODI scores, body mass index (BMI), percent body fat, and AI recently.
ODI scores were recorded at the initial visit and each subsequent visit that the patient made with the physician. AI was measured using sub-max VO2 described by Ebbeling et al. This submaximal walking test, based on a single stage of a treadmill protocol, provides a valid and time-efficient method for estimating VO2 max and is validated for an adult population with spine pain.[
MRI studies were less than a year old and the scans were taken with 1.5 and 3 T magnets. All patient MRIs were reviewed by each of three of the study authors (XXX, YYY, and ZZZ). Each MRI was reviewed using a semi-qualitative scale [
There were 172 patients with complete data analyzed, except for one patient for whom age was not recorded. The mean and range of age of our study population were 50 and 17-85 years, respectively. Patients were divided into those with an AI above the average and those with an AI below the average, and patient data were reviewed for differences (mean AI = 34.87). A series of independent sample hypothesis test indicated that there were no significant differences in BMI or weight between the two groups.
Statistical analysis
Several correlations and comparative statistics were run to examine the relationship between AI, BMI, percent body fat, Oswestry scores, age, height, weight, BMI, and our semi-qualitative scale for measuring fatty infiltrate. Correlations were performed using a linear correlation and evaluated based on Pearson correlation coefficients. Hypothesis testing, including analysis of variance (ANOVA), was performed using SPSS version 18 (SPSS Inc. Chicago). A P value of 0.05 was used to determine significance.
RESULTS
All data are presented in Tables
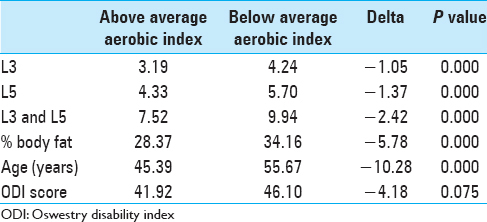

Patients with higher AI values were found to have lower paraspinal fat measurements at both L3 and L5 levels, as well as the two scores combined (P < 0.001), lower body fat percentages (P < 0.001), and were younger (P < 0.001). Our statistical test results for ODI differences did approach statistical significance (P = 0.075) when examining the difference in functional ability (Oswestry) between the above-average and below-average AI groups [
DISCUSSION
We sought to analyze how a broad general fitness measure is correlated with the degree of fatty degeneration in the lumbar paraspinal musculature and patient-perceived disability (ODI). We were able to demonstrate statistically significant differences in the degree of paraspinal fat and body fat percentage when comparing patients with above-average and below-average AI (P < 0.0001). Patients with the highest AI had statistically significant less paraspinal fat at both L3 and L5 levels, as well as the L3 and L5 combined measurement (P < 0.001).
Our results also showed a weak, yet statistically significant negative correlation between AI and disability index score. When comparing the aerobic capacity means between the above- and below-average groups, those with higher aerobic capacity scores had lower ODI scores and these results approached statistical significance (P = 0.075). Previous works examining the relationship between LBP and imaging findings have primarily focused on non-contractile elements of the spine.[
Previous investigations have looked at evaluating the cross-sectional area and fatty infiltrate of the lumbar paraspinals. These studies have shown multifidus atrophy in chronic LBP patients.[
The strengths of this study are that this is the first study to look at various fitness, functional outcomes, and paraspinal fatty degeneration. The relatively large sample size with complete data is another significant strength. Weaknesses include the retrospective design and lack of homogeneity, which is seen with any clinical population. In addition, the methodology of measuring paraspinal fat was not calculated precisely, and it may be another potential weakness.
In conclusion, our results suggest that patients with higher AI values have lower body fat percentages and lower amounts of paraspinal fatty degeneration in the lumbar spine. As a result, the amount of fatty degeneration correlates with physical fitness, and those patients with higher aerobic capacities show trends toward lower disability scores. Therefore, both aerobic capacity and paraspinal fatty degeneration might be used as objective measures to evaluate and monitor progress in LBP patients. Further studies are necessary to see if paraspinal fatty degeneration is reversible with a concerted exercise program and whether that will influence current and future spinal disability.
References
1. Barker KL, Shamley DR, Jackson D. Changes in the cross-sectional area of multifidus and psoas in patients with unilateral back pain: The relationship to pain and disability. Spine (Phila Pa 1976). 2004. 29: E515-9
2. Bishop MD, Horn ME, Lott DJ, Arpan I, George SZ. Magnitude of spinal muscle damage is not statistically associated with exercise-induced low back pain intensity. Spine J. 2011. 11: 1135-42
3. Danneels LA, Vanderstraeten GG, Cambier DC, Witvrouw EE, De Cuyper HJ. CT imaging of trunk muscles in chronic low back pain patients and healthy control subjects. Eur Spine J. 2000. 9: 266-72
4. Ebbeling CB, Ward A, Puleo EM, Widrick J, Rippe JM. Development of a single-stage submaximal treadmill walking test. Med Sci Sports Exerc. 1991. 23: 966-73
5. Fischer MA, Nanz D, Shimakawa A, Schirmer T, Guggenberger R, Chhabra A. Quantification of muscle fat in patients with low back pain: Comparison of multi-echo MR imagina with single-voxel MR spectroscopy. Radiology. 2013. 266: 555-63
6. Heneweer H, Picavet HS, Staes F, Kiers H, Vanhees L. Physical fitness, rather than self-reported physical activities, is more strongly associated with low back pain: Evidence from a working population. Eur Spine J. 2012. 21: 1265-72
7. Jensen MC, Brant-Zawadzki MN, Obuchowski N, Modic MT, Malkasian D, Ross JS. Magnetic resonance imaging of the lumbar spine in people without back pain. N Engl J Med. 1994. 331: 69-73
8. Kader DF, Wardlaw D, Smith FW. Correlation between the MRI changes in the lumbar multifidus muscles and leg pain. Clin Radiol. 2000. 55: 145-9
9. Mengiardi B, Schmid MR, Boos N, Pfirrmann CW, Brunner F, Elfering A. Fat content of lumbar paraspinal muscles in patients with chronic low back pain and in asymptomatic volunteers: Quantification with MR spectroscopy. Radiology. 2006. 240: 786-92
10. Motosuneya T, Asazuma T, Tsuji T, Watanabe H, Nakayama Y, Nemoto K. Postoperative change of the cross-sectional area of back musculature after 5 surgical procedures as assessed by magnetic resonance imaging. J Spinal Disord Tech. 2006. 19: 318-22
11. Ranson CA, Burnett AF, Kerslake R, Batt ME, O’Sullivan PB. An investigation into the use of MR imaging to determine the functional cross sectional area of lumbar paraspinal muscles. Eur Spine J. 2006. 15: 764-73
12. Robert JJ, Blide RW, McWhorter K, Coursey C. The effects of a work hardening program on cardiovascular fitness and muscular strength. Spine (Phila Pa 1976). 1995. 20: 1187-93
13. Stadnik TW, Lee RR, Coen HL, Neirynck EC, Buisseret TS, Osteaux MJ. Annular tears and disk herniation: Prevalence and contrast enhancement on MR images in the absence of low back pain or sciatica. Radiology. 1998. 206: 49-55
14. Stroyer J, Jensen LD. The role of physical fitness as risk indicator of increased low back pain intensity among people working with physically and mentally disabled persons: A 30-month prospective study. Spine (Phila Pa 1976). 2008. 33: 546-54
15. Svensson HO, Vedin A, Wilhelmsson C, Andersson GB. Low-back pain in relation to other diseases and cardiovascular risk factors. Spine (Phila Pa 1976). 1983. 8: 277-85
16. van der Velde G, Mierau D. The effect of exercise on percentile rank aerobic capacity, pain, and self-rated disability in patients with chronic low-back pain: A retrospective chart review. Arch Phys Med Rehabil. 2000. 81: 1457-63