- Department of Neurosurgery All India Institute of Medical Sciences, Rishikesh, Uttarakhand, India
- Department of General Surgery, All India Institute of Medical Sciences, Rishikesh, Uttarakhand, India
- Department of Neurosurgery, John’s Hopkins, Baltimore, Maryland, United States
- Department of Neuroanaesthesia, All India Institute of Medical Sciences, Rishikesh, Uttarakhand, India
- Department of Neurosurgery, National Institute of Mental Health and Neuro Sciences, Bengaluru, Karnataka, India.
Correspondence Address:
Jitender Chaturvedi, Department of Neurosurgery, All India Institute of Medical Sciences, Rishikesh, Uttarakhand, India.
DOI:10.25259/SNI_108_2024
Copyright: © 2024 Surgical Neurology International This is an open-access article distributed under the terms of the Creative Commons Attribution-Non Commercial-Share Alike 4.0 License, which allows others to remix, transform, and build upon the work non-commercially, as long as the author is credited and the new creations are licensed under the identical terms.How to cite this article: Mohit Gupta1, Jitender Chaturvedi1, Farhanul Huda2, Rahul Singh Poonia1, FNU Ruchika3, Nishant Goyal1, Rakesh Sihag1, Saravanan Sadhasivam1, Priyanka Gupta4, Rajneesh Arora1, Sanjay Agrawal4, Dhaval Shukla5. Extracranial pressure (ECP) monitoring in severe traumatic brain injury (TBI): A prospective study validating intra-abdominal pressure (IAP) measurement for predicting intracranial pressure (ICP). 28-Jun-2024;15:216
How to cite this URL: Mohit Gupta1, Jitender Chaturvedi1, Farhanul Huda2, Rahul Singh Poonia1, FNU Ruchika3, Nishant Goyal1, Rakesh Sihag1, Saravanan Sadhasivam1, Priyanka Gupta4, Rajneesh Arora1, Sanjay Agrawal4, Dhaval Shukla5. Extracranial pressure (ECP) monitoring in severe traumatic brain injury (TBI): A prospective study validating intra-abdominal pressure (IAP) measurement for predicting intracranial pressure (ICP). 28-Jun-2024;15:216. Available from: https://surgicalneurologyint.com/?post_type=surgicalint_articles&p=12969
Abstract
Background: Intracranial pressure (ICP)-guided therapy is the standard of care in the management of severe traumatic brain injury (TBI). Ideal ICP monitoring technique is not yet available, based on its risks associated with bleeding, infection, or its unavailability at major centers. Authors propose that ICP can be gauged based on measuring pressures of other anatomical cavities, for example, the abdominal cavity. Researchers explored the possibility of monitoring intra-abdominal pressure (IAP) to predict ICP in severe TBI patients.
Methods: We measured ICP and IAP in severe TBI patients. ICP was measured using standard right frontal external ventricular drain (EVD) insertion and connecting it to the transducer. IAP was measured using a well-established technique of vesical pressure measurement through a manometer.
Results: A total of 28 patients (n = 28) with an age range of 18–65 years (mean of 32.36 years ± 13.52 years [Standard deviation]) and the median age of 28.00 years with an interquartile range (21.00–42.00 years) were recruited in this prospective study. About 57.1% (n = 16) of these patients were in the age range of 18–30 years. About 92.9% (n = 26) of the patients were male. The most common mode of injury (78.6%) was road traffic accidents (n = 22) and the mean Glasgow Coma Scale at presentation was 4.04 (range 3–9). The mean ICP measured at the presentation of this patient cohort was 20.04 mmHg. This mean ICP (mmHg) decreased from a maximum of 20.04 at the 0 h’ time point (at the time of insertion of EVD) to a minimum of 12.09 at the 96 hr time point. This change in mean ICP (from 0 h to 96 h) was found to be statistically significant (Friedman Test: χ2 = 87.6, P ≤ 0.001). The mean IAP (cmH2O) decreased from a maximum of 16.71 at the 0 h’ time point to a minimum of 9.68 at the 96 h’ time point. This change was statistically significant (Friedman Test: χ2 = 71.8, P ≤ 0.001). The per unit percentage change in IAP on per unit percentage change in ICP we observed was correlated to each other. The correlation coefficient between these variables varied from 0.71 to 0.89 at different time frames. It followed a trend in a directly proportional manner and was found to be statistically significant (P
Conclusion: In this study, we established that the ICP of severe TBI patients correlates well with IAP at presentation. This correlation was strong and constant, irrespective of the timeframe during the treatment and monitoring. This study also established that draining cerebrospinal fluid to decrease ICP in severe TBI patients is reflected in IAP. The study validates that IAP is a strong proxy of ICP in severe TBI patients.
Keywords: Extracranial pressure, Intra-abdominal pressure, Intracranial pressure, Monitoring, Severe traumatic brain injury
INTRODUCTION
There are invasive and noninvasive cerebral monitoring techniques to prevent/halt secondary brain damage. Intracranial pressure (ICP) monitoring is the most commonly used invasive procedure to prevent, early detect, and treat secondary insults to the brain. ICP-directed therapy shows at least more salvageability in traumatic brain injury (TBI) patients. Further, ICP monitoring became an established practice following recommendations for its use in Brain Trauma Foundation (BTF) guidelines,[
The fundamental question of whether we can gauze ICP without inserting anything inside the brain was investigated in our study. To address this, we postulated that elevated ICP in TBI patients is also transmitted to other anatomical compartments, such as the abdominal cavity. We extrapolated this fact to measure and correlate extracranial pressure (ECP), that is, intra-abdominal pressure (IAP) with ICP in severe TBI patients. Sup pose ICP can be replaced with ECP (e.g., IAP). In that case, the benefits of ICP-guided therapy can be given to severe TBI patients without subjecting these patients to more invasive, expensive, and technically demanding ICP monitors.
MATERIALS AND METHODS
All patients who presented to the Neurotrauma Centre at All India Institute of Medical Sciences (AIIMS), Rishikesh, with a diagnosis of severe TBI underwent (in addition to the standard of care of severe TBI, including ICP monitoring) IAP monitoring by the international standard. In this prospective study, patients were recruited from July 2021 to February 2023. Age, gender, mode of injury, and presence/absence of extracranial injuries, such as abdominal-thoracic trauma, pelvic injuries, or long bone fractures, were noted. Brain imaging parameters for TBI, such as midline shift, contusion site, contusion volume, or basal cistern effacement, were recorded according to Marshal computed tomography (CT) grading. Glasgow Coma Scale (GCS) and pupillary response were recorded at presentation, immediately following resuscitation, and continuously every 4th h.
An external ventricular drain (EVD) catheter was used to monitor ICP. An indwelling urinary catheter was inserted to monitor urinary output and to measure IAP. ICP and IAP were continuously monitored and recorded until the removal of the ICP monitor was deemed appropriate (stable ICP of < 15 mmHg for 48 hours) or for a maximum monitoring duration of one week. One week is chosen as the decision for surgical decompression or continuation of best medical management is made by this time.
Inclusion criteria
We included all patients who sustained TBI with a GCS score of 10 or below after resuscitation and an abnormal CT scan. The patient group with GCS 9 and 10 was added to the severe TBI (GCS 3–8) group to improve the sample size and salvageability. Patients with severe TBI and a normal head CT were only included if two or more features were present at admission: age >40 years, unilateral or bilateral motor posturing, or a systolic blood pressure <90 mmHg. We only included patients that were followed for at-least 3 months post-injury.
Exclusion criteria
Patients suffering from severe coagulopathy, the only major contraindication to ICP monitoring by EVD insertion, were excluded from the study. We excluded all patients with severe TBI who had concomitant abdominal injuries requiring laparotomy or serial observations by general surgeons. We excluded pregnant women and children <3 years of age. We also excluded patients who had undergone abdominal, urinary bladder, or urethral surgery, as these conditions make IAP measurement difficult or unreliable. Patients with urethral strictures/injuries (inability to pass an indwelling catheter) were also excluded from the study. Patients with concomitant spine trauma were omitted as dysautonomia after spinal shock influences abdominal pressure on its own.
Ethical approval
The study was approved by the Institutional Ethics Committee (IEC), AIIMS/IEC/21/610.
IAP measurement
We used vesical pressure measurement as a low-cost, upfront, and reproducible method for calculating the IAP using a 50 mL syringe, an intravenous (IV) infusion set, an appropriatesized Foley catheter, a measuring scale, and a hemostat.
The IV infusion set connection was disconnected from the infusion tube and attached to a syringe containing 25 mL of saline. Saline was injected into the empty bladder after being attached to the main drainage channel of the Foley catheter. The connector was then secured with the aid of a rubber-shod hemostat. The connector connected to the Foley catheter was removed along with the empty syringe. Next, the connector was attached to the IV set tubing, held vertically above the symphysis. After releasing the hemostat, saline flows out of the catheter drainage tubing until it reaches the IAP in saline height (measured in cm). The measurement is done supine at end-expiration, zeroed at the iliac crest in the mid-axillary line, and taken 30–60 s after injecting 25 mL of saline to give the bladder detrusor muscle time to relax. Values can be expressed in millimeters of mercury (1 mmHg = 1.36 cmH2O).
ICP measurement
ICP was measured by placing a standard EVD catheter into one of the lateral ventricles (preferably the right frontal horn), which was connected to a transducer through a three-way tap. The transducer was zeroed to atmospheric pressure at the level of tragus. The transducer was then connected to monitor for ICP values, 10ml/hr of CSF was drained if deemed necessary by the treating physician to reduce the ICP. Readings were taken 10 min after stopping the CSF drainage through a three-way tap, and pressure readings were taken on the ICP monitor.
Zeroing in Philips Monitor EVD transducer placed at the level of ear (i.e., Foramen of Monro) and 3-way tap in EVD system was turned off. The cap was removed to open the transducer to the atmosphere, and “zero” was pressed on the monitor while the transducer was still open. The button was pressed twice, and the machine beeped once completed. The transducer connected to the monitor when the screen displayed “ICP zeroed.” CSF samples were sent for culture, and non-contrast CT was performed to verify the catheter position. 10 mL CSF was drained every time the ICP threshold raised to 22 mmHg or above, as per the protocol.
RESULTS
Demographic Data
Demographic data are shown in
A maximum number of patients enrolled in the study presented with Marshall CT class 3, i.e., 60.7% (n = 17) and class 5, i.e., 21.4% (n = 6). 10.7% (n = 3) of the patients had Marshall CT Class 4, and only two patients presented with Marshall CT Class 2.
ICP
All patients receive standardized intensive care unit (ICU) care consisting of anti-edema, anti-epileptics, and other conservative management protocols. The overall trend of change in ICP can be seen in
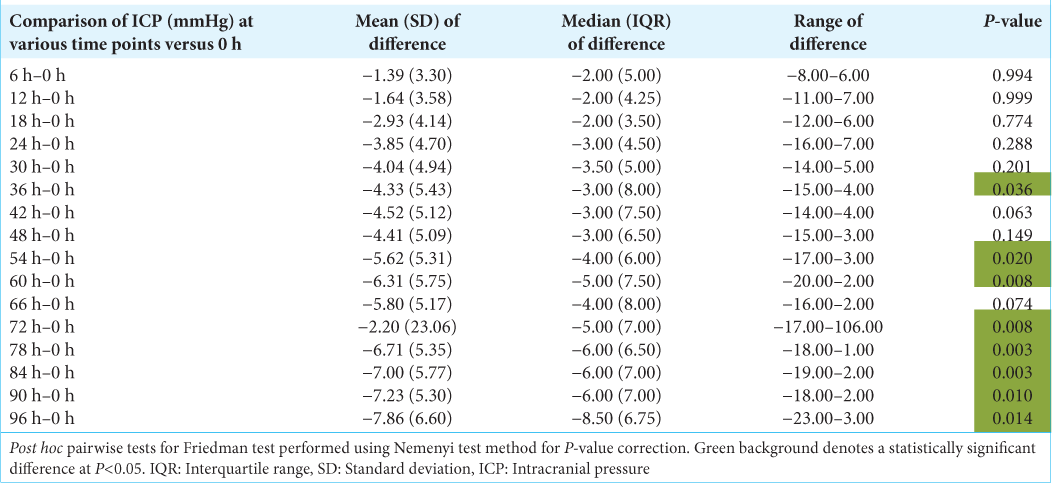
As shown in
IAP
The mean IAP (cmH2O) decreased from a maximum of 16.71 at the 0 h’ time point to a minimum of 9.68 at the 96 h’ time point. This change was statistically significant (Friedman test: χ2 = 71.8, P ≤ 0.001). The overall trend of change in IAP can be seen in
As shown in
Relationship between ICP and IAP
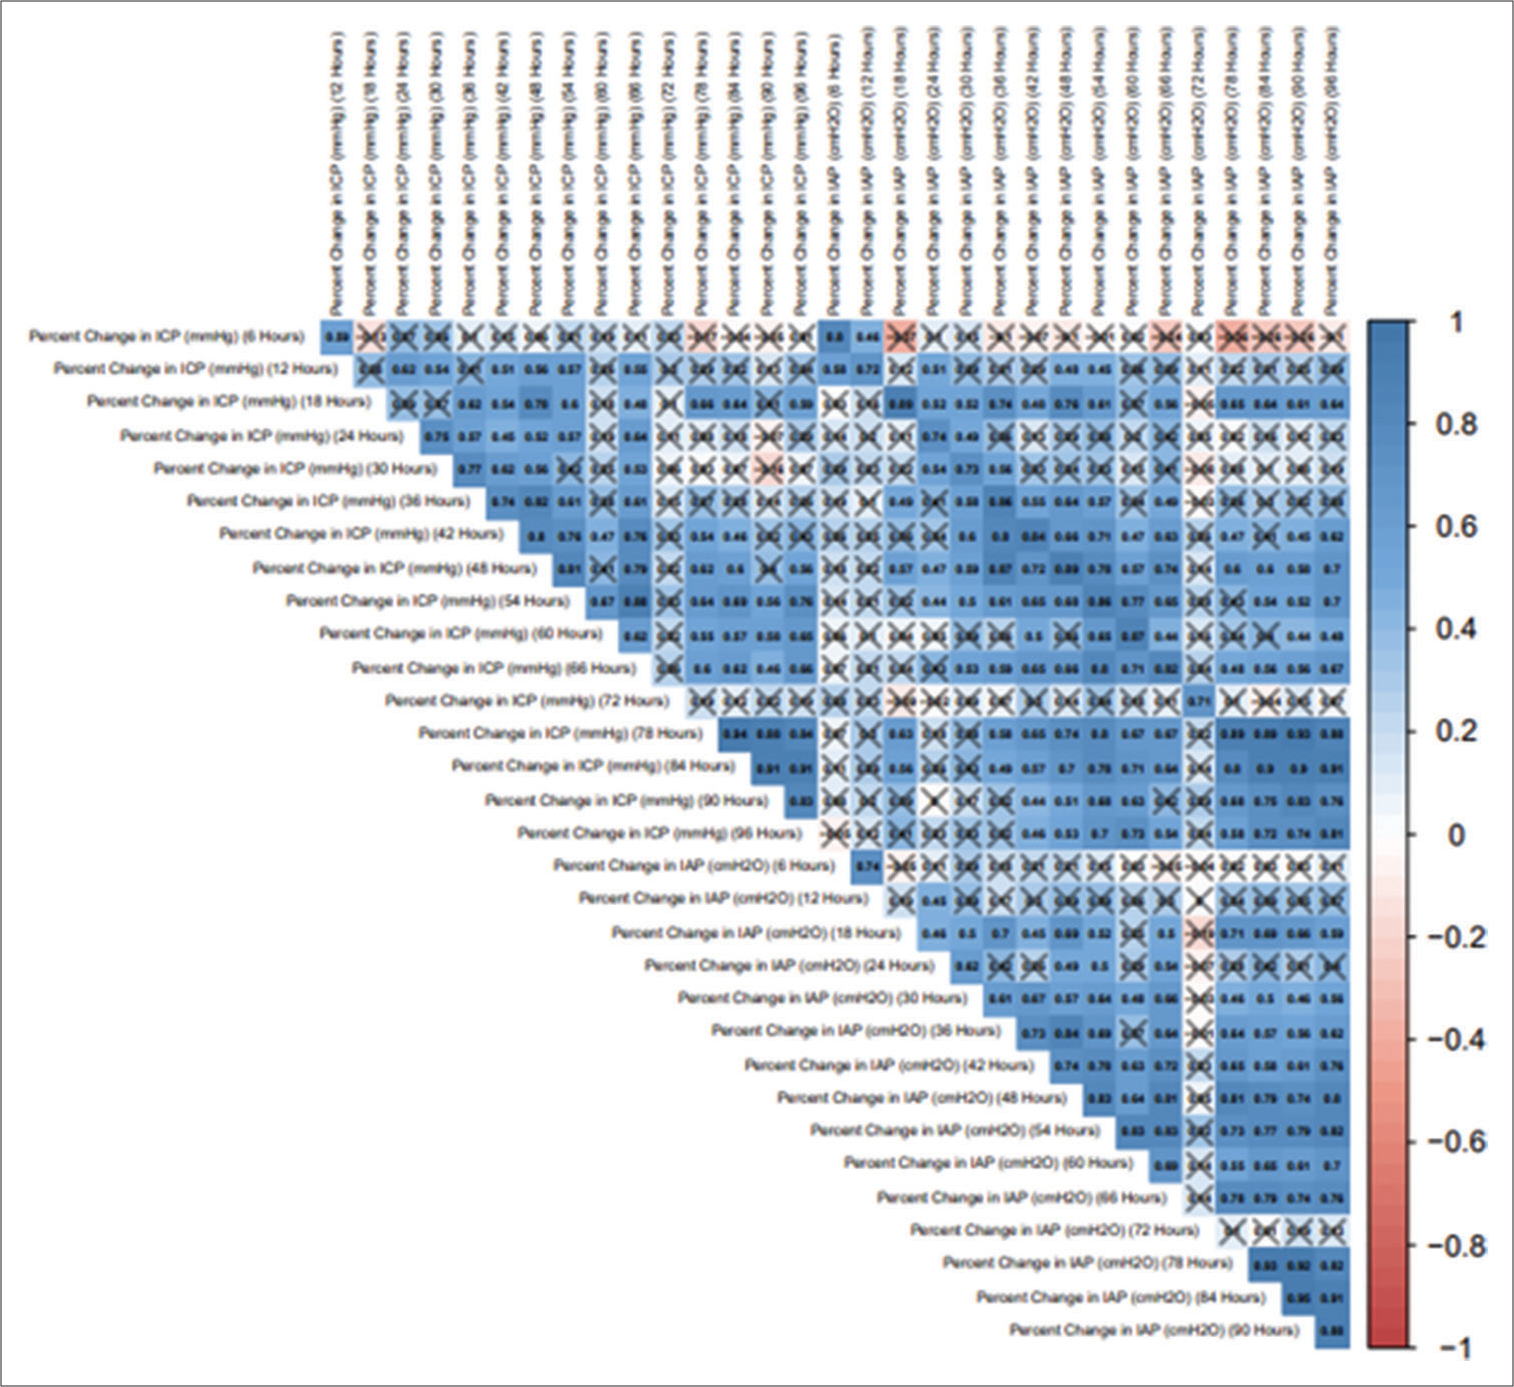
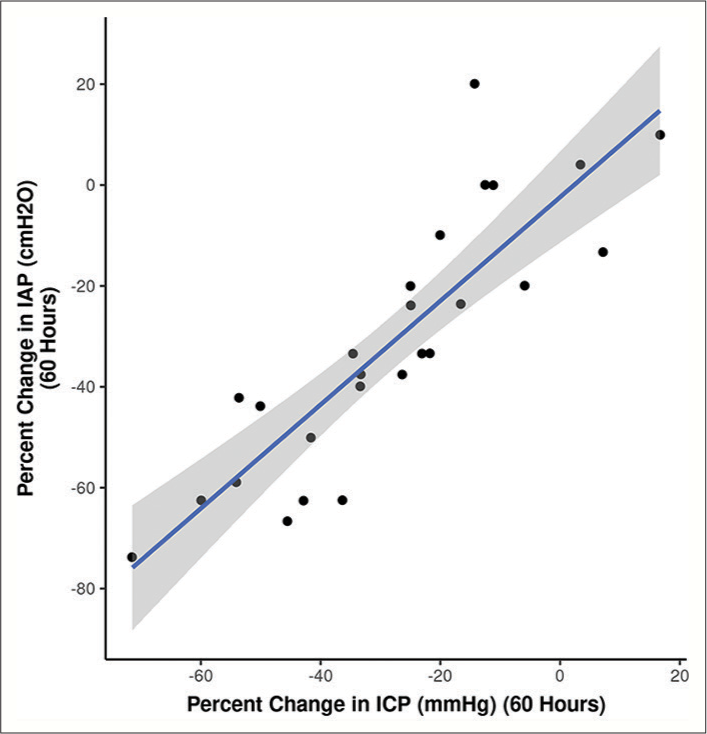
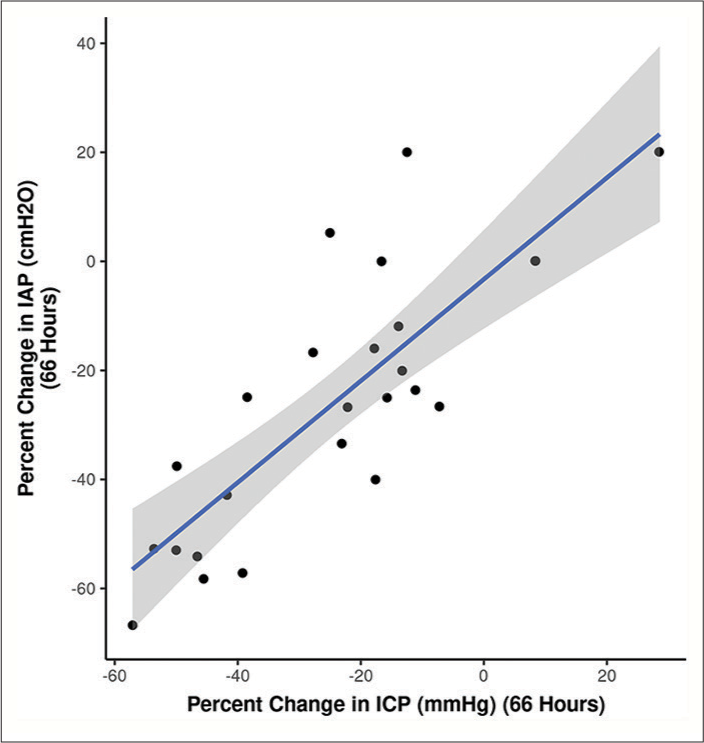
To further scrutinize our notion, we followed and compared the percentage change in ICP with the percentage change in IAP at different time frames. The correlogram shown in
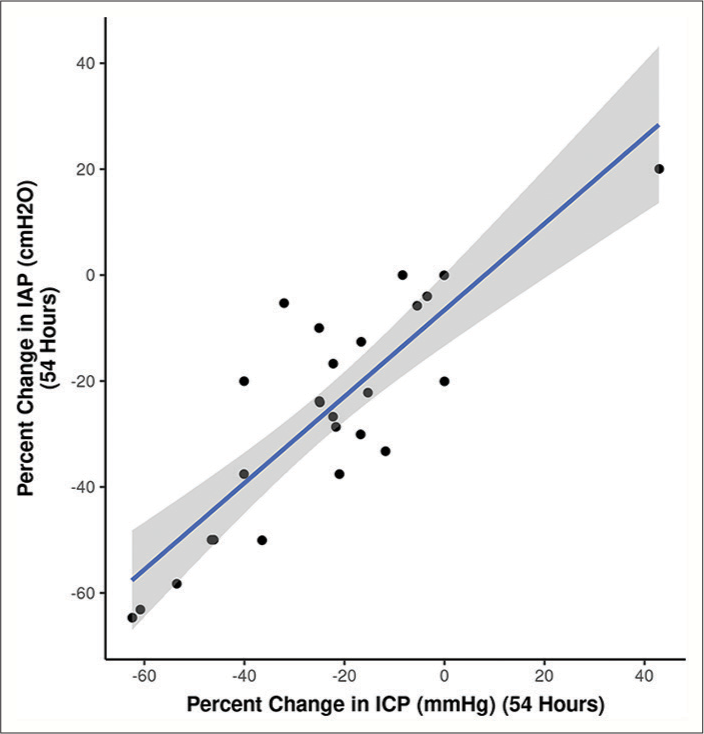
Figure 8:
Baseline intracranial pressure (ICP) values correlate with the ICP levels reached during weight positioning (high-intra-abdominal pressure, IAP), depicted in the linear regression model[
As shown in
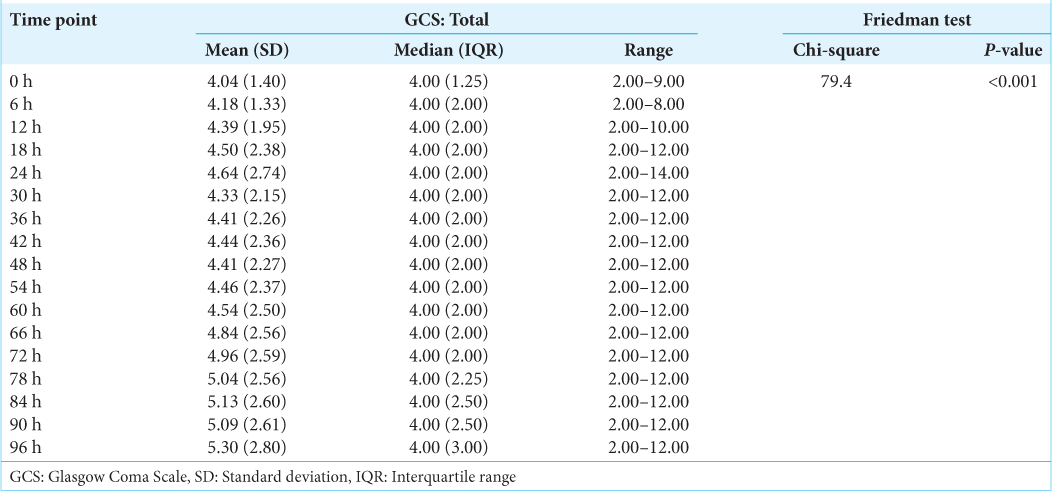
GCS
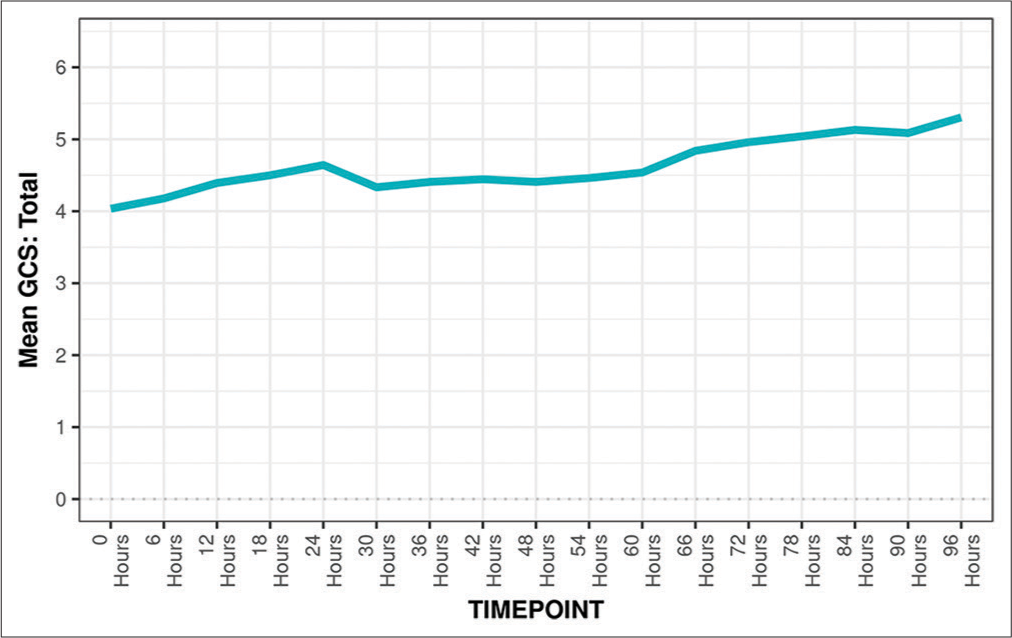
Monitoring GCS as shown in
DISCUSSION
Raised ICP is undisputedly the most significant contributor to poor outcomes after TBI. However, barring a few Level I trauma centers in LMIC (Low and Middle Income Countries), the clinical management of patients with TBI rarely includes ICP monitoring.
The conventional approach, which calls for the invasive insertion of an ICP sensor into brain parenchymal tissue or ventricles, might be one of the factors for the infrequent ICP monitoring at most centers. Additional limiting factors include the expense of an ICU set-up required for implanting the ICP sensors and the scarcity of skilled personnel.
Direct and indirect additional investments are included in the cost of ICP monitoring in managing severe TBI patients. The stated benefit, treatment recommendations, and potential prognostic value that ICP monitoring carries must all be weighed against the cost of purchasing and maintaining ICP sensor probes, monitoring parameters, ICU and nursing care following insertion, and infection risk (its treatment included).
Hence, finding other methods to gauge ICP becomes essential in such resource limited settings. Such an alternative must effectively replace ICP monitoring by being accurate, cost-effective, easy to monitor, and less invasive to minimize complications. IAP is one such proxy meter in patients suffering from TBI.
In India, 1 out of every six trauma victims dies, compared to 1 out of every 200 in the US. This disparity, which appears impenetrable, speaks much about the refined prehospital practices in the US (or other developed nations) and their almost thorough absence in India. Within the first 2 h of damage, there is almost a 50% mortality rate. It is now well recognized that secondary injury, which develops over hours and days after the primary impact, contributes more significantly to the deterioration than the primary insult. Increased mortality and disability may be the result of uncontrolled inflammation and edema, the hallmark of secondary injury. As a result, outcomes following TBI depends on the prompt and appropriate therapy directed towards mitigating secondary effects of TBI. Decompressive craniectomy, followed by cranioplasty (and its associated complications) in survivors, is the most common surgical response after sustaining TBI.[
TBI is a significant cause of disability among trauma victims in India. The age range 20–29 years is the most affected, followed by 30–39 years, and thus, TBI can also be considered an epidemic of the young population.[
In the current study, the mean (SD) of age (years) was 32.36 (± 13.52) with an age range from 18 to 65 years, and the median (IQR) of age (years) was 28.00 (21–42). This large proportion of the young population holding the majority share among a cohort of TBI patients is well explained by the increased risk of exposure to contributory factors of TBI as they are the most traveling group of the population to earn a livelihood, to study, and are also the primary workforce of society.
Age has been extensively studied as a predictor of mortality in TBI patients. In many studies, old age has been identified as a predictor of poor outcomes.[
In India, road traffic injuries are the primary cause of TBIs (60%), followed by falls (20–25%) and violence (10%).[
Alali et al., in their study,[
In contrast, Grade II was a minor criterion. They observed that the rule was highly sensitive, that is, 93.9%. However, they had a very low specificity, that is, 42.3%, in predicting intracranial hypertension and thus can be a helpful guide to select patients who require ICP monitoring.
In the current study, the average Marshall score of patients who expired was 3.9, which was much higher than the average Marshall score of patients who survived, which was 2.85.
In patients with head injuries, ICP monitoring is critical[
Farahvar et al., in their study [
ICP monitoring can be done either by invasive or noninvasive methods. Among the invasive methods, EVD is the gold standard and has the benefits of being therapeutic apart from its diagnostic role. However, in patients with brain swelling with small ventricles or distorted normal anatomy due to mass effect, EVD insertion can be difficult.[
Bloomfield et al. tried to study[
Bloomfield et al. extended their study[
Citerio et al. in their study[
Deeren et al. were the first to examine with a large number of measurements whether increases in IAP are associated with increases in ICP and decreases in CPP in ventilated patients with non-TBI.[
To the best of our knowledge, no study has monitored continuous IAP and ICP in severe TBI patients and establishing relationships, if any. Our study is the first ever done on humans (no such study on animal models either) to establish a trend between IAP and ICP in TBI patients and test its validity for using IAP as a proxy for ICP. Our study monitored 17 continuous readings 6 hours apart and established that the IAP trend follows the ICP trend. We also drain 10 mL CSF every time the ICP reading goes above 22 mmHg and noticed that IAP also follows the fall trend in ICP on draining CSF. Both IAP and ICP differed significantly from the 0 h’ time point compared to other time points, and IAP followed the trend of ICP with varying magnitudes on each unit change. Our study also observed that the 0 h IAP and ICP differed significantly from 36 h IAP and ICP, respectively.
In neurointensive care, monitoring is increasingly utilized to detect brain ischemia before it occurs and to direct focused therapy to improve cerebral perfusion and oxygenation.[
This study has its strengths and limitations. As the CSF was drained to control ICP, the waveform did not follow a usual trend, which it might have followed with other ICP monitoring techniques where CSF is not drained, for example, the parenchymal probe. Furthermore, in retrospect, authors tend to consider a long tunnel EVD to keep it longer and thus follow the trend beyond 96 h. Despite this, the study has the largest sample size in the literature for continuous ICP and concomitant IAP readings in patients with severe TBI. It is the first study that recorded the effect of change in ICP on IAP based on continuous ICP monitoring. In addition, our study established that free-hand EVD placement could be done even in thin ventricles with diffuse brain edema, as in cases of severe TBI.
Despite its limitations, ICP monitoring remains central to the monitoring and managing severe TBI. Multiple studies in the past have done interventions to change IAP and see its effect on change in ICP. However, this study was the first to do an intervention to change ICP (EVD and CSF drainage) and recorded a concomitant change in IAP.
CONCLUSION
In this study, authors established that the ICP of severe TBI patients correlate well with IAP at presentation. This correlation was intense and constant, irrespective of the timeframe during the treatment and monitoring. This study also established that draining CSF to decrease ICP in severe TBI patients is reflected in IAP. The study further validates that IAP is a proxy of ICP in severe TBI patients.
Ethical approval
The research/study approved by the Institutional Review Board at AIIMS Rishikesh India, number AIIMS/IEC/21/610, dated November 26, 2021.
Declaration of patient consent
The authors certify that they have obtained all appropriate patient consent.
Financial support and sponsorship
The publication fee for this article was covered by the James I. and Carolyn R. Ausman Educational Foundation.
Conflicts of interest
There are no conflicts of interest.
Use of artificial intelligence (AI)-assisted technology for manuscript preparation
The authors confirm that there was no use of artificial intelligence (AI)-assisted technology for assisting in the writing or editing of the manuscript and no images were manipulated using AI.
Disclaimer
The views and opinions expressed in this article are those of the authors and do not necessarily reflect the official policy or position of the Journal or its management. The information contained in this article should not be considered to be medical advice; patients should consult their own physicians for advice as to their specific medical needs.
References
1. Alali AS, Temkin N, Barber J, Pridgeon J, Chaddock K, Dikmen S. A clinical decision rule to predict intracranial hypertension in severe traumatic brain injury. J Neurosurg. 2018. 131: 612-9
2. Bloomfield GL, Ridings PC, Blocher CR, Marmarou A, Sugerman HJ. A proposed relationship between increased intra-abdominal, intrathoracic, and intracranial pressure. Crit Care Med. 1997. 25: 496-503
3. Bloomfield GL, Ridings PC, Blocher CR, Marmarou A, Sugerman HJ. Effects of increased intra-abdominal pressure upon intracranial and cerebral perfusion pressure before and after volume expansion. J Trauma Inj Infect Crit Care. 1996. 40: 936-43
4. Chaturvedi J, Botta R, Prabhuraj AR, Shukla D, Bhat DI, Devi BI. Complications of cranioplasty after decompressive craniectomy for traumatic brain injury. Br J Neurosurg. 2016. 30: 264-8
5. Citerio G, Vascotto E, Villa F, Celotti S, Pesenti A. Induced abdominal compartment syndrome increases intracranial pressure in neurotrauma patients: A prospective study. Crit Care Med. 2001. 29: 1466-71
6. Deeren DH, Dits H, Malbrain ML. Correlation between intra-abdominal and intracranial pressure in nontraumatic brain injury. Intensive Care Med. 2005. 31: 1577-81
7. Dewan MC, Rattani A, Gupta S, Baticulon RE, Hung YC, Punchak M. Estimating the global incidence of traumatic brain injury. J Neurosurg. 2018. 130: 1080-97
8. Farahvar A, Gerber LM, Chiu YL, Carney N, Härtl R, Ghajar J. Increased mortality in patients with severe traumatic brain injury treated without intracranial pressure monitoring. J Neurosurg. 2012. 117: 729-34
9. Gururaj G. Epidemiology of traumatic brain injuries: Indian scenario. Neurol Res. 2002. 24: 24-8
10. Lundberg N. Continuous recording and control of ventricular fluid pressure in neurosurgical practice. Acta Psychiatr Scand Suppl. 1960. 36: 1-193
11. Resnick DK, Marion DW, Carlier P. Outcome analysis of patients with severe head injuries and prolonged intracranial hypertension. J Trauma Inj Infect Crit Care. 1997. 42: 1108-11
12. Saul TG, Ducker TB. Effect of intracranial pressure monitoring and aggressive treatment on mortality in severe head injury. J Neurosurg. 1982. 56: 498-503
13. Stiefel MF, Spiotta A, Gracias VH, Garuffe AM, Guillamondegui O, Maloney-Wilensky E. Reduced mortality rate in patients with severe traumatic brain injury treated with brain tissue oxygen monitoring. J Neurosurg. 2005. 103: 805-11
14. Stiefel MF, Udoetuk JD, Spiotta AM, Gracias VH, Goldberg A, Maloney-Wilensky E. Conventional neurocritical care and cerebral oxygenation after traumatic brain injury. J Neurosurg. 2006. 105: 568-75
15. Timofeev I, Gupta A. Monitoring of head injured patients. Curr Opin Anaesthesiol. 2005. 18: 477-83


