- Department of Neurosurgery, Kesennuma City Hospital, Kesennuma, Miyagi, Japan,
- Department of Neurosurgery, Iwaki City Medical Center, Iwaki, Fukushima, Japan,
- Department of Neurosurgery, Tohoku University Graduate School of Medicine, Sendai, Miyagi, Japan.
Correspondence Address:
Norio Narita
Department of Neurosurgery, Tohoku University Graduate School of Medicine, Sendai, Miyagi, Japan.
DOI:10.25259/SNI_3_2021
Copyright: © 2020 Surgical Neurology International This is an open-access article distributed under the terms of the Creative Commons Attribution-Non Commercial-Share Alike 4.0 License, which allows others to remix, tweak, and build upon the work non-commercially, as long as the author is credited and the new creations are licensed under the identical terms.How to cite this article: Masahito Katsuki1, Norio Narita1, Keisuke Sasaki2, Yoshimichi Sato2, Yasuhiro Suzuki2, Shoji Mashiyama2, Teiji Tominaga3. Standard values for temporal muscle thickness in the Japanese population who undergo brain check-up by magnetic resonance imaging. 23-Feb-2021;12:67
How to cite this URL: Masahito Katsuki1, Norio Narita1, Keisuke Sasaki2, Yoshimichi Sato2, Yasuhiro Suzuki2, Shoji Mashiyama2, Teiji Tominaga3. Standard values for temporal muscle thickness in the Japanese population who undergo brain check-up by magnetic resonance imaging. 23-Feb-2021;12:67. Available from: https://surgicalneurologyint.com/surgicalint-articles/10602/
Date of Submission
02-Jan-2021
Date of Acceptance
09-Feb-2021
Date of Web Publication
23-Feb-2021
Abstract
Background: Skeletal muscle mass is an important factor for various diseases’ outcomes. The psoas muscle cross-sectional area on the abdominal computed tomography (CT), gait speed, and handgrip strength is used to measure it. However, it is difficult to measure the neurological patients’ muscle mass or function because (1) we do not perform abdominal CT. (2) Such patients have impaired consciousness, gait disturbance, paresis, and need of rest. Temporal muscle thickness (TMT) on magnetic resonance imaging (MRI) is now attractive for skeletal muscle volume indicator, but the reference values are not established. We herein investigated the standard value of the Japanese TMT using the brain check-up database by MRI.
Methods: We retrospectively investigated 360 Japanese individuals from two institutions between 2017 and 2019. We measured TMT on the T1-weighted images in the previously reported way. The associations between TMT and other variables were analyzed.
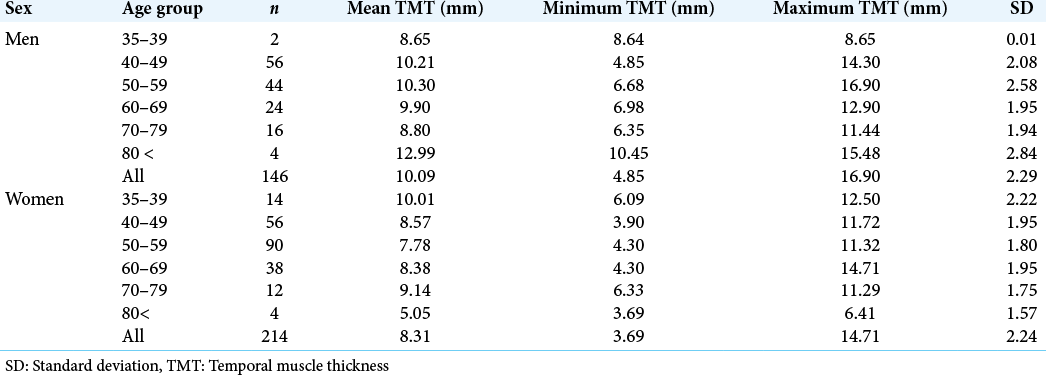
Results: TMT of 214 women and 146 men, ranging from 35 to 84 years old, was investigated. TMT ranged from 3.69 to 16.90 mm. Mean TMT values were significantly higher in men compared to women except for the over 70-year-old cohort. TMT was correlated to weight and body mass index in both sexes.
Conclusion: This is the first retrospective study on the standard TMT values from the Japanese brain check-up database. Our results were just reference values, but these would be useful for further investigation in other neurosurgical and neurological diseases regarding muscle volume or sarcopenia.
Keywords: Aging, Nutrition, Sarcopenia, Skeletal muscle volume, Temporal muscle thickness
INTRODUCTION
Low skeletal muscle mass due to low nutrition or aging (sarcopenia in the broadest sense[
Therefore, we focused on the temporal muscle thickness (TMT) on magnetic resonance imaging (MRI). Recently, TMT is substituted as a useful and safe measure of the total body skeletal muscle mass.[
The standard TMT values of healthy Caucasian individuals were reported,[
MATERIALS AND METHODS
Study population
We retrospectively retrieved data from the brain checkup database of all the 360 healthy Japanese individuals at two institutions. One hospital provided 149 individuals between 2017 and 2019, and the other hospital provided 211 individuals during 2018. People who underwent brain check-up had to pay 24,000 JPY. The hospitals’ research ethics committees approved this study. We gained written informed consent for this study from all of the individuals. All methods were carried out under relevant guidelines and regulations (Declaration of Helsinki).
Clinical variables
We collected data of age, sex, height, weight, and body mass index (BMI). We used SIGNA Pioneer 3.0T (GE Healthcare Life Sciences, Buckinghamshire, England) by a 24-channel head-neck coil and acquired MR images. We measured TMT on an axial plane of the T1-weighted image (T1WI) in the previously reported way.[
According to the Fazekas scale, we also evaluated periventricular hyperintensity (PVH) on fluid-attenuated inversion recovery images.[
Statistical analysis
Intraclass correlation coefficients tested the inter-rater reliabilities of TMT. The results are described as mean ± standard deviation (SD), and sex- and age-related mean TMT reference values were given as means with SDs and ranges. The associations between TMT and other factors were investigated by the Mann–Whitney U-test or Spearman’s coefficient correlation. R > 0.2 was defined that there was a significant correlation. A two-tailed P < 0.05 was considered statistically significant. We conducted this calculation using the SPSS software version 24.0.0. (IBM, New York, USA).
RESULTS
Clinical characteristics and TMT
TMT characteristics of the 360 individuals (214 women and 146 men) ranging from 35 to 84 years old are summarized in [
TMT and other variables
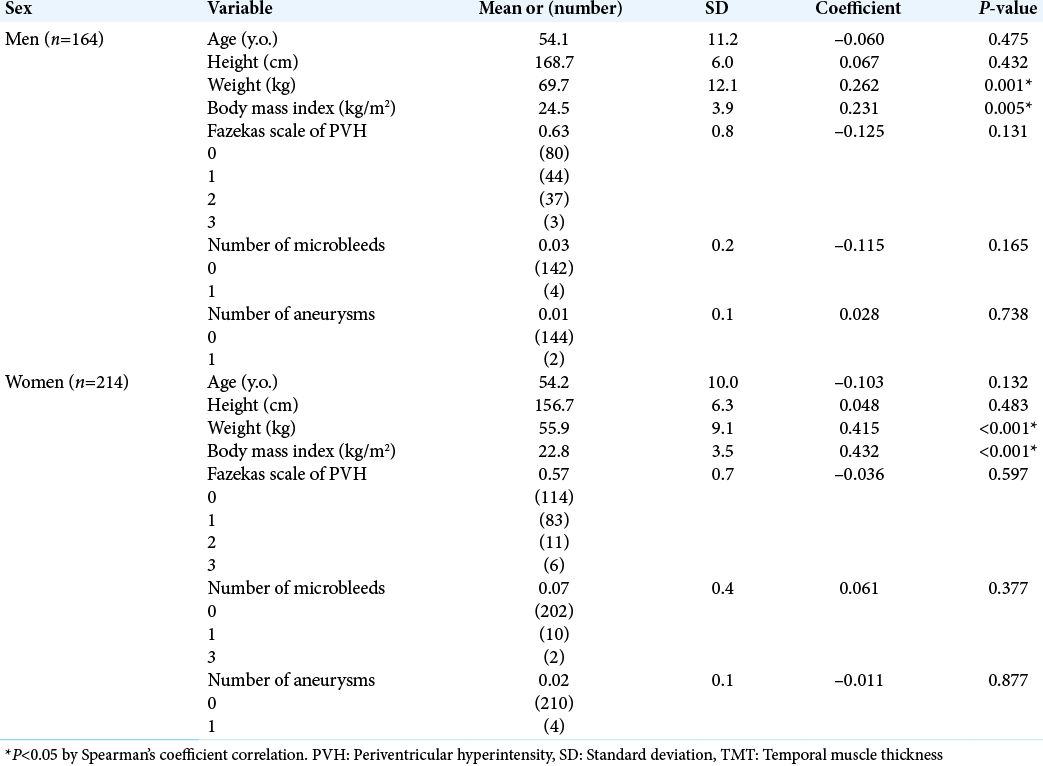
TMT was correlated to weight and BMI in both sexes (TMT vs. weight in men; r = 0.262; P = 0.001, TMT vs. BMI in men; r = 0.231; P = 0.005, TMT vs. weight in women; r = 0.415; P < 0.001, TMT vs. BMI in women; r = 0.432; P < 0.001). Age, height, Fazekas PVH scale, the numbers of microbleeds, and aneurysms were not correlated to TMT in both sexes (P > 0.05) [
DISCUSSION
We retrospectively investigated TMT from the brain check-up database from two institutions. Our results were just reference values, but this is the first report regarding TMT standard values of Japanese individuals who underwent brain check-up.
The usefulness of TMT as indicators of skeletal muscle mass in neurosurgical and neurological diseases
Several reports on the association between skeletal muscle mass and neurosurgical diseases are reported. Higher skeletal muscle mass reduces the risk of intracranial arterial stenosis and may protect against ischemic stroke.[
Previously, TMT thresholds in the MRI for the outcomes in various diseases were investigated, but some studies yielded inconsistent results in TMT values. TMT in MRI over the median was associated with favorable outcomes in brain metastasis.[
It is not easy to compare the threshold values of TMT because the investigator, methods, and modality were different in each study. However, research on the temporalis muscle is still in its infancy. Therefore, investigating the threshold is meaningful for the clinical practice, and further prospective studies are desired.
The difference from the previous study on Caucasian
Steindl reported standard TMT values of healthy Caucasian individuals.[
Limitations
First, the sample size was small. Second, we did not measure actual skeletal muscle volume nor muscle function. Therefore, it is uncertain that TMT was really surrogate markers of skeletal muscle mass in this study. Furthermore, it is unknown that TMT was determined congenitally and whether they can be enlarged by training like chewing. Third, we did not investigate laboratory test results, such as albumin, total cholesterol, nor lymphocyte count, which are marker of nutrition status.[
CONCLUSION
We retrospectively investigated standard TMT values from the brain check-up database of two institutions. Our results were just reference values, but these would be useful for further investigation in other neurosurgical and neurological diseases regarding muscle volume or sarcopenia.
Declaration of patient consent
The authors certify that they have obtained all appropriate patient consent.
Financial support and sponsorship
Nil.
Conflicts of interest
There are no conflicts of interest.
References
1. An G, Ahn S, Park JS, Jeun SS, Hong YK. Association between temporal muscle thickness and clinical outcomes in patients with newly diagnosed glioblastoma. J Cancer Res Clin Oncol. 2020. 147: 901-9
2. Bayram S, Akgül T, Adıyaman AE, Karalar Ş Dölen D, Aydoseli A. Effect of sarcopenia on mortality after percutaneous vertebral augmentation treatment for osteoporotic vertebral compression fractures in elderly patients: A retrospective cohort study. World Neurosurg. 2020. 138: e354-60
3. Binay Safer V, Safer U. Comment on Clinical characteristics of aneurysmal subarachnoid hemorrhage (SAH) in the elderly over 75: Would temporal muscle be a potential prognostic factor as an indicator of sarcopenia?. Clin Neurol Neurosurg. 2020. 188: 105600
4. Chen LK, Liu LK, Woo J, Assantachai P, Auyeung TW, Bahyah KS. Sarcopenia in Asia: Consensus report of the Asian working group for sarcopenia. J Am Med Dir Assoc. 2014. 15: 95-101
5. Cinkir HY, Er HC. Is temporal muscle thickness a survival predictor in newly diagnosed glioblastoma multiforme?. Asia Pac J Clin Oncol. 2020. 16: e223-7
6. Cruz-Jentoft AJ, Baeyens JP, Bauer JM, Boirie Y, Cederholm T, Landi F. Sarcopenia: European consensus on definition and diagnosis: Report of the european working group on sarcopenia in older people. Age Ageing. 2010. 39: 412-23
7. Cruz-Jentoft AJ, Bahat G, Bauer J, Boirie Y, Bruyère O, Cederholm T. Sarcopenia: Revised European consensus on definition and diagnosis. Age Ageing. 2019. 48: 16-31
8. de Ulíbarri JI, González-Madroño A, de Villar NG, González P, González B, Mancha A. CONUT: A tool for controlling nutritional status. First validation in a hospital population Nutr Hosp. 2005. 20: 38-45
9. Fazekas F, Kleinert R, Offenbacher H, Payer F, Schmidt R, Kleinert G. The morphologic correlate of incidental punctate white matter hyperintensities on MR images. AJNR Am J Neuroradiol. 1991. 12: 915-21
10. Furtner J, Berghoff AS, Albtoush OM, Woitek R, Asenbaum U, Prayer D. Survival prediction using temporal muscle thickness measurements on cranial magnetic resonance images in patients with newly diagnosed brain metastases. Eur Radiol. 2017. 27: 3167-73
11. Furtner J, Berghoff AS, Schöpf V, Reumann R, Pascher B, Woitek R. Temporal muscle thickness is an independent prognostic marker in melanoma patients with newly diagnosed brain metastases. J Neurooncol. 2018. 140: 173-8
12. Furtner J, Genbrugge E, Gorlia T, Bendszus M, Nowosielski M, Golfinopoulos V. Temporal muscle thickness is an independent prognostic marker in patients with progressive glioblastoma: Translational imaging analysis of the EORTC 26101 trial. Neuro Oncol. 2019. 21: 1587-94
13. Hasegawa Y, Yoshida M, Sato A, Fujimoto Y, Minematsu T, Sugama J. Temporal muscle thickness as a new indicator of nutritional status in older individuals. Geriatr Gerontol Int. 2019. 19: 135-40
14. Hida T, Eastlack RK, Kanemura T, Mundis GM, Imagama S, Akbarnia BA. Effect of race, age, and gender on lumbar muscle volume and fat infiltration in the degenerative spine. J Orthop Sci. 2020. p.
15. Hsieh K, Hwang M, Estevez-Inoa G, Saraf A, Spina CS, Smith D. Temporalis muscle width as a measure of sarcopenia independently predicts overall survival in patients with newly diagnosed glioblastoma. Int J Radiat Oncol. 2018. 102: e225
16. Ishihara H, Oka F, Goto H, Nishimoto T, Okazaki K, Sadahiro H. Impact of frailty on medium-term outcome in asymptomatic patients after carotid artery stenting. World Neurosurg. 2019. 127: e396-9
17. Jones KI, Doleman B, Scott S, Lund JN, Williams JP. Simple psoas cross-sectional area measurement is a quick and easy method to assess sarcopenia and predicts major surgical complications. Colorectal Dis. 2015. 17: O20-6
18. Jung HJ, Jung H, Lee T, Kim J, Park J, Kim H. Decreased muscle mass in Korean subjects with intracranial arterial stenosis: The Kangbuk samsung health study. Atherosclerosis. 2017. 256: 89-93
19. Katsuki M, Kakizawa Y, Nishikawa A, Yamamoto Y, Uchiyama T.editors. Temporal muscle thickness and area are an independent prognostic factors in patients aged 75 or younger with aneurysmal subarachnoid hemorrhage treated by clipping. Surg Neurol Int. 2021. p.
20. Katsuki M, Kakizawa Y, Nishikawa A, Yasunaga Y, Toshiya U. Total protein and neuronavigation are novel prognostic factors of endoscopic hematoma removal for intracerebral hemorrhage. J Stroke Cerebrovasc Dis. 2020. 29: 105050
21. Katsuki M, Kakizawa Y, Nishikawa A, Yasunaga Y, Uchiyama T. Endoscopic hematoma removal of supratentorial intracerebral hemorrhage under local anesthesia reduces operative time compared to craniotomy. Sci Rep. 2020. 10: 10389
22. Katsuki M, Suzuki Y, Kunitoki K, Sato Y, Sasaki K, Mashiyama S. Temporal muscle as an indicator of sarcopenia is independently associated with Hunt and Kosnik grade on admission and the modified rankin scale score at 6 months of patients with subarachnoid hemorrhage treated by endovascular coiling. World Neurosurg. 2020. 137: e526-34
23. Katsuki M, Suzuki Y, Sato Y, Sasaki K, Shingai Y, Mashiyama S.editors. In reply to the letter to the editor regarding temporal muscle as an indicator of sarcopenia is independently associated with Hunt and Kosnik grade on admission and the modified rankin scale at 6 months of patients with subarachnoid hemorrhage treated by endovascular coiling. World Neurosurg. 2020. p. 140-433
24. Katsuki M, Yamamoto Y, Uchiyama T, Wada N, Kakizawa Y. Clinical characteristics of aneurysmal subarachnoid hemorrhage in the elderly over 75; would temporal muscle be a potential prognostic factor as an indicator of sarcopenia?. Clin Neurol Neurosurg. 2019. 186: 105535
25. Leitner J, Pelster S, Schöpf V, Berghoff AS, Woitek R, Asenbaum U. High correlation of temporal muscle thickness with lumbar skeletal muscle cross-sectional area in patients with brain metastases. PLoS One. 2018. 13: e0207849
26. Liu F, Xing D, Zha Y, Wang L, Dong W, Li L. Predictive value of temporal muscle thickness measurements on cranial magnetic resonance images in the prognosis of patients with primary glioblastoma. Front Neurol. 2020. 11: 523292
27. Malmstrom TK, Morley JE. SARC-F: A simple questionnaire to rapidly diagnose sarcopenia. J Am Med Dir Assoc. 2013. 14: 531-2
28. Matsushita T, Nishioka S, Taguchi S, Yamanouchi A, Nakashima R, Wakabayashi H. Sarcopenic obesity and activities of daily living in stroke rehabilitation patients: A cross-sectional study. Healthcare (Basel). 2020. 8: 255
29. Minn YK, Suk SH. Higher skeletal muscle mass may protect against ischemic stroke in community-dwelling adults without stroke and dementia: The PRESENT project. BMC Geriatr. 2017. 17: 45
30. Muglia R, Simonelli M, Pessina F, Morenghi E, Navarria P, Persico P. Prognostic relevance of temporal muscle thickness as a marker of sarcopenia in patients with glioblastoma at diagnosis. Eur Radiol. 2020. p.
31. Nishiguchi S, Hino K, Moriya K, Shiraki M, Hiramatsu A, Nishikawa H.editors. Assessment criteria for sarcopenia in liver disease (first edition): Report from the working group for creation of sarcopenia assessment criteria in the Japan society of hepatology. Kanzo. 2016. 57: 353-68
32. Nozoe M, Kanai M, Kubo H, Kobayashi M, Yamamoto M, Shimada S. Quadriceps muscle thickness changes in patients with aneurysmal subarachnoid hemorrhage during the acute phase. Top Stroke Rehabil. 2018. 25: 209-13
33. Ranganathan K, Terjimanian M, Lisiecki J, Rinkinen J, Mukkamala A, Brownley C. Temporalis muscle morphomics: The psoas of the craniofacial skeleton. J Surg Res. 2014. 186: 246-52
34. Rinkinen J, Zhang P, Wang L, Enchakalody B, Terjimanian M, Holcomb S. Novel temporalis muscle and fat pad morphomic analyses aids preoperative risk evaluation and outcome assessment in nonsyndromic craniosynostosis. J Craniofac Surg. 2013. 24: 250-5
35. Safer U, Tasci I, Safer VB.editors. Letter to the editor regarding effect of sarcopenia on mortality after percutaneous vertebral augmentation treatment for osteoporotic vertebral compression fractures in elderly patients: A retrospective cohort study. World Neurosurg. 2020. p. 139-710
36. Someya Y, Tamura Y, Suzuki R, Kaga H, Kadowaki S, Sugimoto D. Characteristics of glucose metabolism in underweight Japanese women. J Endocr Soc. 2018. 2: 279-89
37. Song WC, Choi HG, Kim SH, Kim SH, Hu KS, Kim HJ. Topographic anatomy of the zygomatic arch and temporal fossa: A cadaveric study. J Plast Reconstr Aesthet Surg. 2009. 62: 1375-8
38. Sousa AS, Guerra RS, Fonseca I, Pichel F, Ferreira S, Amaral TF. Financial impact of sarcopenia on hospitalization costs. Eur J Clin Nutr. 2016. 70: 1046-51
39. Steindl A, Leitner J, Schwarz M, Nenning KH, Asenbaum U, Mayer S. Sarcopenia in neurological patients: Standard values for temporal muscle thickness and muscle strength evaluation. J Clin Med. 2020. 9: 1272
40. Uhlich R, Hu P. Sarcopenia diagnosed using masseter muscle area predictive of early mortality following severe traumatic brain injury. Neural Regen Res. 2018. 13: 2089-90
41. Verri ED, da Silva GP, Fioco EM, da Silva NS, Fabrin SC, Zanella CA. Effects of Parkinson’s disease on molar bite force, electromyographic activity and muscle thickness of the masseter, temporal and sternocleidomastoid muscles: A case-control study. J Oral Rehabil. 2019. 9: 1272